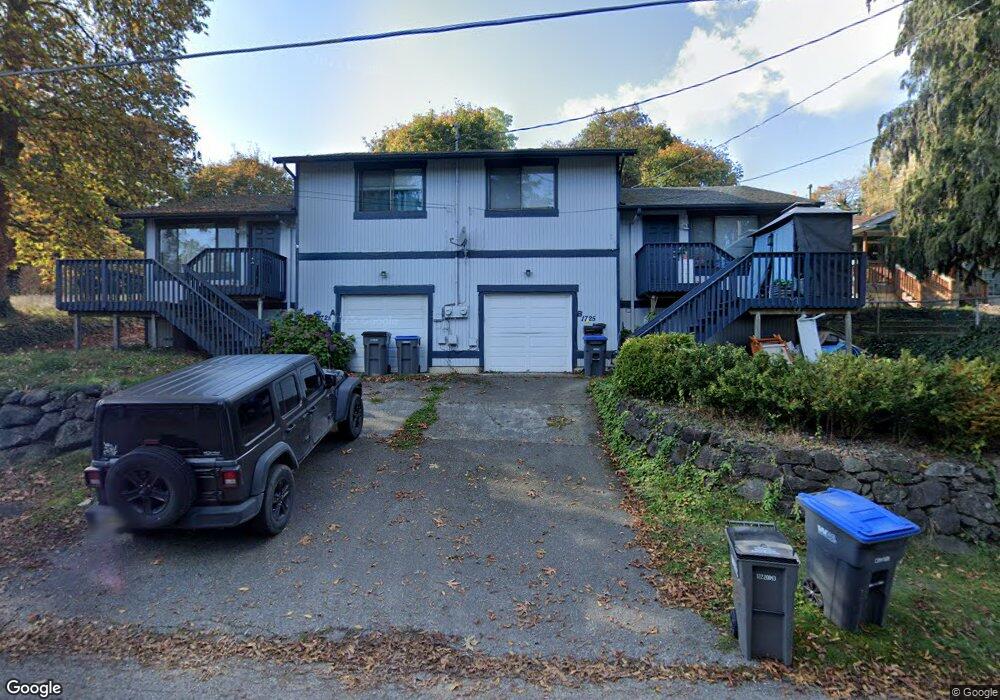
1723 N Callow Ave Unit A Bremerton, WA 98312
Estimated Value: $394,000 - $597,000
3
Beds
2
Baths
1,512
Sq Ft
$335/Sq Ft
Est. Value
About This Home
This home is located at 1723 N Callow Ave Unit A, Bremerton, WA 98312 and is currently estimated at $505,822, approximately $334 per square foot. 1723 N Callow Ave Unit A is a home located in Kitsap County with nearby schools including Crownhill Elementary School, Mountain View Middle School, and Bremerton High School.
Ownership History
Date
Name
Owned For
Owner Type
Purchase Details
Closed on
Jan 27, 2015
Sold by
Morris Henry M and Morris Cecelia G
Bought by
Church Michael A and Church Christina A
Current Estimated Value
Home Financials for this Owner
Home Financials are based on the most recent Mortgage that was taken out on this home.
Original Mortgage
$114,750
Outstanding Balance
$87,857
Interest Rate
3.75%
Mortgage Type
New Conventional
Estimated Equity
$417,965
Purchase Details
Closed on
Nov 10, 2005
Sold by
Davis Henry D
Bought by
Morris Henry M and Morris Cecelia G
Home Financials for this Owner
Home Financials are based on the most recent Mortgage that was taken out on this home.
Original Mortgage
$232,000
Interest Rate
3%
Mortgage Type
Purchase Money Mortgage
Purchase Details
Closed on
Mar 24, 1997
Sold by
Gonzalez David A and Gonzalez Deborah H
Bought by
Davis Henry D
Home Financials for this Owner
Home Financials are based on the most recent Mortgage that was taken out on this home.
Original Mortgage
$129,000
Interest Rate
7.63%
Mortgage Type
VA
Create a Home Valuation Report for This Property
The Home Valuation Report is an in-depth analysis detailing your home's value as well as a comparison with similar homes in the area
Home Values in the Area
Average Home Value in this Area
Purchase History
| Date | Buyer | Sale Price | Title Company |
|---|---|---|---|
| Church Michael A | $153,000 | Fidelity Ntl | |
| Morris Henry M | $290,280 | Land Title Company | |
| Davis Henry D | $129,000 | Land Title Company |
Source: Public Records
Mortgage History
| Date | Status | Borrower | Loan Amount |
|---|---|---|---|
| Open | Church Michael A | $114,750 | |
| Previous Owner | Morris Henry M | $232,000 | |
| Previous Owner | Davis Henry D | $129,000 |
Source: Public Records
Tax History Compared to Growth
Tax History
| Year | Tax Paid | Tax Assessment Tax Assessment Total Assessment is a certain percentage of the fair market value that is determined by local assessors to be the total taxable value of land and additions on the property. | Land | Improvement |
|---|---|---|---|---|
| 2026 | $3,662 | $415,170 | $80,920 | $334,250 |
| 2025 | $3,662 | $415,170 | $80,920 | $334,250 |
| 2024 | $3,534 | $415,170 | $80,920 | $334,250 |
| 2023 | $3,653 | $415,170 | $80,920 | $334,250 |
| 2022 | $3,395 | $346,890 | $67,430 | $279,460 |
| 2021 | $3,025 | $282,940 | $50,860 | $232,080 |
| 2020 | $2,806 | $262,210 | $47,070 | $215,140 |
| 2019 | $2,411 | $233,440 | $42,020 | $191,420 |
| 2018 | $2,653 | $163,180 | $31,590 | $131,590 |
| 2017 | $2,137 | $163,180 | $31,590 | $131,590 |
| 2016 | $2,011 | $145,330 | $27,710 | $117,620 |
| 2015 | $2,054 | $147,740 | $30,140 | $117,600 |
| 2014 | -- | $140,720 | $30,140 | $110,580 |
| 2013 | -- | $163,450 | $31,810 | $131,640 |
Source: Public Records
Map
Nearby Homes
- 1714 N Wycoff Ave
- 1551 N Callow Ave
- 3173 19th St
- 1948 N Rainier Ave
- 2117 E Phinney Bay Dr
- 2011 Taft Ave
- 2150 N Callow Ave
- 1103 N Wycoff Ave Unit A
- 1602 Naval Ave Unit 27
- 1309 Times Ave
- 1303 Times Ave
- 0 Thompson Dr
- 1325 Marguerite Ave
- 1135 Morgan Rd NW Unit A & B
- 10 XX Naval Ave
- 10xx Naval Ave
- 1515 Pennsylvania Ave
- 2540 E Phinney Bay Place
- 1910 11th St
- 1818 Jackson Dr
- 1723 N Callow Ave Unit B
- 1723 N Callow Ave
- 1723 N Callow Ave Unit A & B
- 1725 N Callow Ave Unit A & B
- 1725 N Callow Ave
- 1729 N Callow Ave
- 1721 N Callow Ave
- 1730 N Wycoff Ave
- 1715 N Callow Ave
- 1736 N Wycoff Ave
- 1714 N Wycoff Ave Unit B
- 1744 N Wycoff Ave
- 1743 N Callow Ave
- 0 N Wycoff Ave Unit 29062921
- 0 N Wycoff Ave Unit 29091942
- 1741 N Callow Ave
- 1709 N Callow Ave Unit 1711 North Callow Av
- 1709 N Callow Ave
- 1742 N Wycoff Ave