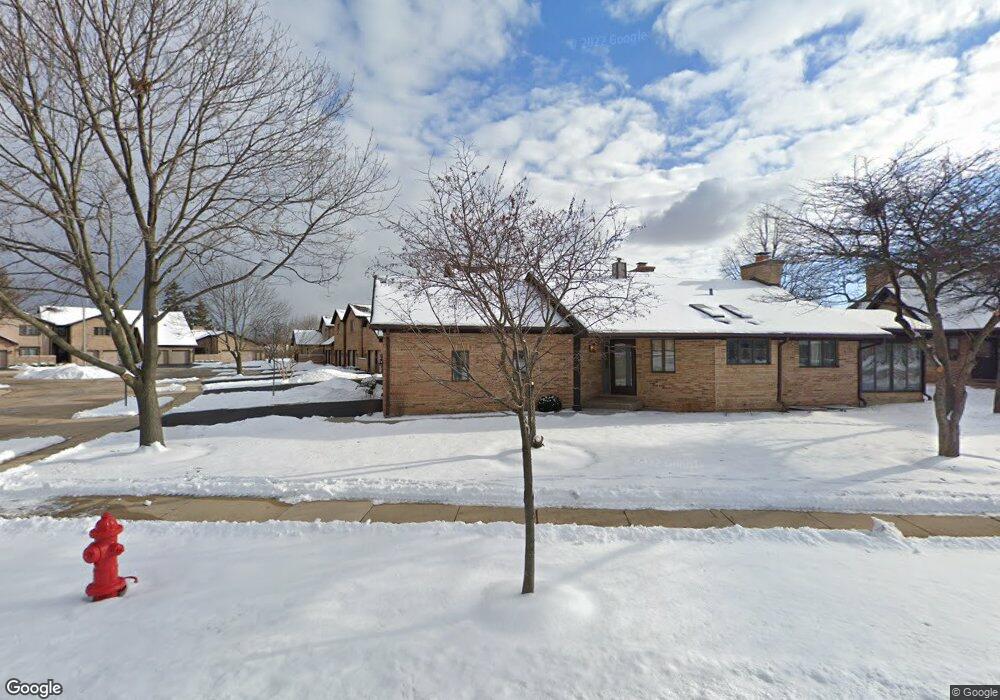
1723 Pebble Beach Dr Hoffman Estates, IL 60169
South Hoffman Estates NeighborhoodEstimated Value: $359,000 - $376,000
2
Beds
2
Baths
1,604
Sq Ft
$230/Sq Ft
Est. Value
About This Home
This home is located at 1723 Pebble Beach Dr, Hoffman Estates, IL 60169 and is currently estimated at $368,480, approximately $229 per square foot. 1723 Pebble Beach Dr is a home located in Cook County with nearby schools including Neil Armstrong Elementary School, Dwight D Eisenhower Junior High School, and Hoffman Estates High School.
Ownership History
Date
Name
Owned For
Owner Type
Purchase Details
Closed on
Apr 1, 2024
Sold by
Prakash Dinesh and Prakash Vinita
Bought by
Dinesh And Vinita Prakash Trust and Prakash
Current Estimated Value
Purchase Details
Closed on
Jan 22, 2019
Sold by
Mtglq Investors Lp
Bought by
Grzybowska Mariola
Home Financials for this Owner
Home Financials are based on the most recent Mortgage that was taken out on this home.
Original Mortgage
$125,000
Interest Rate
3.87%
Mortgage Type
New Conventional
Purchase Details
Closed on
Jun 26, 2018
Sold by
Poplar Creek Club Homes Homeowners Assoc
Bought by
Mtglq Investors Lp
Purchase Details
Closed on
Jul 28, 1997
Sold by
Thornton James D and Thornton Lorayne D
Bought by
Mckean Martin D
Home Financials for this Owner
Home Financials are based on the most recent Mortgage that was taken out on this home.
Original Mortgage
$129,000
Interest Rate
7.12%
Create a Home Valuation Report for This Property
The Home Valuation Report is an in-depth analysis detailing your home's value as well as a comparison with similar homes in the area
Home Values in the Area
Average Home Value in this Area
Purchase History
| Date | Buyer | Sale Price | Title Company |
|---|---|---|---|
| Dinesh And Vinita Prakash Trust | -- | None Listed On Document | |
| Grzybowska Mariola | $185,000 | Attorney | |
| Mtglq Investors Lp | -- | None Available | |
| Mckean Martin D | $147,000 | -- |
Source: Public Records
Mortgage History
| Date | Status | Borrower | Loan Amount |
|---|---|---|---|
| Previous Owner | Grzybowska Mariola | $125,000 | |
| Previous Owner | Mckean Martin D | $129,000 |
Source: Public Records
Tax History Compared to Growth
Tax History
| Year | Tax Paid | Tax Assessment Tax Assessment Total Assessment is a certain percentage of the fair market value that is determined by local assessors to be the total taxable value of land and additions on the property. | Land | Improvement |
|---|---|---|---|---|
| 2024 | $6,761 | $28,000 | $4,500 | $23,500 |
| 2023 | $8,316 | $28,000 | $4,500 | $23,500 |
| 2022 | $8,316 | $28,000 | $4,500 | $23,500 |
| 2021 | $6,196 | $18,492 | $1,891 | $16,601 |
| 2020 | $6,051 | $18,492 | $1,891 | $16,601 |
| 2019 | $5,011 | $20,547 | $1,891 | $18,656 |
| 2018 | $4,960 | $18,645 | $1,651 | $16,994 |
| 2017 | $4,890 | $18,645 | $1,651 | $16,994 |
| 2016 | $4,811 | $18,645 | $1,651 | $16,994 |
| 2015 | $4,940 | $18,003 | $1,441 | $16,562 |
| 2014 | $4,870 | $18,003 | $1,441 | $16,562 |
| 2013 | $4,727 | $18,003 | $1,441 | $16,562 |
Source: Public Records
Map
Nearby Homes
- 1698 Pebble Beach Dr
- 1121 Southbridge Ln
- 1103 Southbridge Ln
- 1415 N Oakmont Rd
- 1365 Blair Ln
- 1352 W Oakmont Rd
- 1375 Rebecca Dr Unit 318
- 1475 Crowfoot Cir S
- 1475 Rebecca Dr Unit 217
- 1020 Denham Place Unit 1
- 1912 Finchley Ct Unit 3
- 775 Harmon Blvd
- 1763 Bristol Walk Unit 1763
- 1360 Devonshire Ln
- 808 Bishop Ct Unit 2
- 1704 Fayette Walk Unit B
- 700 N Hundley St
- 1808 Fayette Walk Unit H
- 1105 Wilmington Ln
- 1840 Huntington Blvd Unit 415
- 1723 Pebble Beach Ct
- 1721 Pebble Beach Ct
- 1721 Pebble Beach Dr
- 1725 Pebble Beach Ct
- 1719 Pebble Beach Dr
- 1727 Pebble Beach Dr
- 1729 Pebble Beach Dr
- 1729 Pebble Beach Ct
- 1731 Pebble Beach Dr
- 1717 Pebble Beach Dr
- 1733 Pebble Beach Ct
- 1735 Pebble Beach Dr
- 1711 Pebble Beach Ct
- 1737 Pebble Beach Dr
- 1591 W Oakmont Rd
- 1593 W Oakmont Rd
- 1739 Pebble Beach Dr
- 1739 Pebble Beach Ct
- 1707 Pebble Beach Dr
- 1184 Harmon Blvd