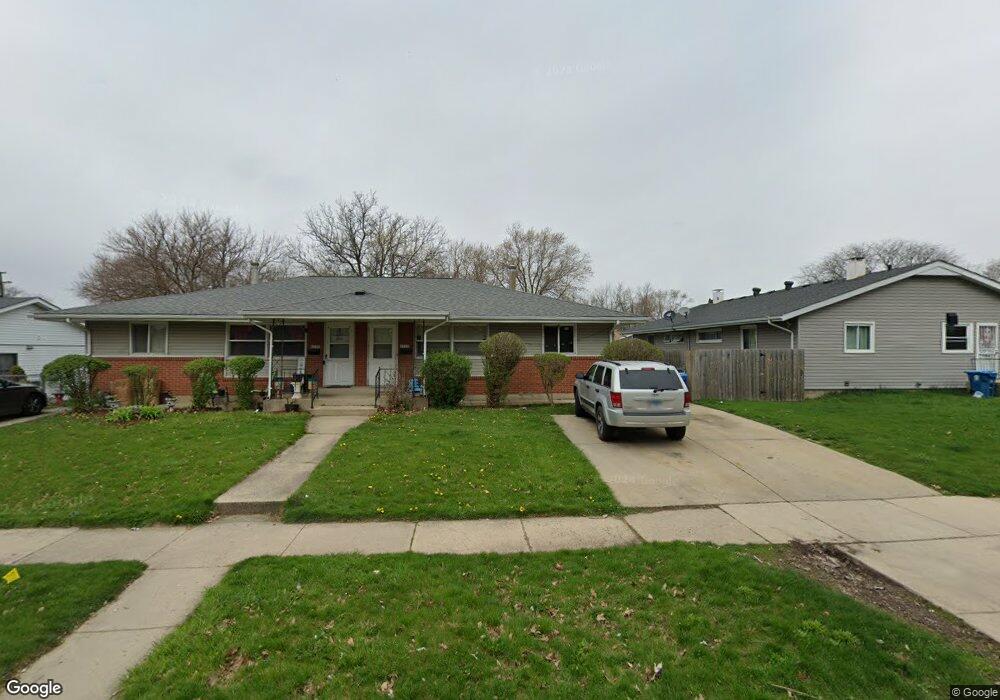
1723 Plum St Unit 2 Aurora, IL 60506
Edgelawn Randall NeighborhoodEstimated Value: $303,000 - $322,000
4
Beds
3
Baths
1,904
Sq Ft
$164/Sq Ft
Est. Value
About This Home
This home is located at 1723 Plum St Unit 2, Aurora, IL 60506 and is currently estimated at $312,757, approximately $164 per square foot. 1723 Plum St Unit 2 is a home located in Kane County with nearby schools including Mccleery Elementary School, Jefferson Middle School, and West Aurora High School.
Ownership History
Date
Name
Owned For
Owner Type
Purchase Details
Closed on
Jun 9, 2008
Sold by
Azemi Azem and Azemi Iftadije
Bought by
Azemis Management Llc
Current Estimated Value
Purchase Details
Closed on
Oct 27, 2003
Sold by
Azemi Azem
Bought by
Azemi Azem and Azemi Ifladije
Home Financials for this Owner
Home Financials are based on the most recent Mortgage that was taken out on this home.
Original Mortgage
$100,000
Interest Rate
6.01%
Mortgage Type
New Conventional
Purchase Details
Closed on
Mar 14, 2000
Sold by
Renteria Apolonio and Renteria Maria
Bought by
Azemi Azem
Home Financials for this Owner
Home Financials are based on the most recent Mortgage that was taken out on this home.
Original Mortgage
$105,000
Interest Rate
8.43%
Purchase Details
Closed on
Aug 8, 1997
Sold by
Eno David A and Eno Raquel
Bought by
Renteria Apolonio and Renteria Maria C
Home Financials for this Owner
Home Financials are based on the most recent Mortgage that was taken out on this home.
Original Mortgage
$107,567
Interest Rate
7.71%
Mortgage Type
FHA
Create a Home Valuation Report for This Property
The Home Valuation Report is an in-depth analysis detailing your home's value as well as a comparison with similar homes in the area
Home Values in the Area
Average Home Value in this Area
Purchase History
| Date | Buyer | Sale Price | Title Company |
|---|---|---|---|
| Azemis Management Llc | -- | None Available | |
| Azemi Azem | -- | Law Title Ins Co Inc | |
| Azemi Azem | $135,000 | First American Title Ins Co | |
| Renteria Apolonio | $72,000 | -- |
Source: Public Records
Mortgage History
| Date | Status | Borrower | Loan Amount |
|---|---|---|---|
| Previous Owner | Azemi Azem | $100,000 | |
| Previous Owner | Azemi Azem | $105,000 | |
| Previous Owner | Renteria Apolonio | $107,567 |
Source: Public Records
Tax History
| Year | Tax Paid | Tax Assessment Tax Assessment Total Assessment is a certain percentage of the fair market value that is determined by local assessors to be the total taxable value of land and additions on the property. | Land | Improvement |
|---|---|---|---|---|
| 2024 | $7,390 | $93,336 | $12,487 | $80,849 |
| 2023 | $7,143 | $83,395 | $11,157 | $72,238 |
| 2022 | $6,410 | $72,409 | $10,180 | $62,229 |
| 2021 | $6,159 | $67,414 | $9,478 | $57,936 |
| 2020 | $5,862 | $62,618 | $8,804 | $53,814 |
| 2019 | $6,069 | $62,061 | $8,157 | $53,904 |
| 2018 | $5,527 | $55,365 | $7,545 | $47,820 |
| 2017 | $6,196 | $60,207 | $6,952 | $53,255 |
| 2016 | $5,646 | $53,147 | $5,959 | $47,188 |
| 2015 | -- | $45,138 | $5,124 | $40,014 |
| 2014 | -- | $41,865 | $4,709 | $37,156 |
| 2013 | -- | $42,578 | $4,642 | $37,936 |
Source: Public Records
Map
Nearby Homes
- 220 N Rosedale Ave
- 540 N Rosedale Ave Unit 4
- 123 N Rosedale Ave
- 20 Central Ave
- 1615 Heather Dr
- 231 W Downer Place
- 140 S Westlawn Ave
- 1421 Heather Dr
- 1344 W Galena Blvd
- 1358 Monomoy St Unit A
- 2140 Sandburg Dr
- 833 N Randall Rd Unit C4
- 1387 S Glen Cir Unit D
- 1930 Richard St Unit 1
- 1480 Colorado Ave
- 1086 Cascade Dr Unit 1
- 1061 S Pleasure Ct
- 8 S Commonwealth Ave
- 220 S Calumet Ave
- 1039 S Pleasure Ct
- 1727 Plum St Unit 29
- 500 N Rosedale Ave Unit 502
- 1726 Rosedale Ct
- 1735 Plum St Unit 37
- 512 N Rosedale Ave
- 1730 Rosedale Ct Unit 32
- 222 N Rosedale Ave
- 1730 Plum St
- 1703 Plum St
- 1738 Plum St Unit 1742
- 1743 Plum St Unit 45
- 511 N Rosedale Ave
- 1701 Plum St
- 1745 Plum St
- 1746 Plum St
- 511 N Edgelawn Dr Unit 513
- 517 N Rosedale Ave
- 1706 Plum St
- 1721 Rosedale Ct
- 212 N Rosedale Ave
Your Personal Tour Guide
Ask me questions while you tour the home.