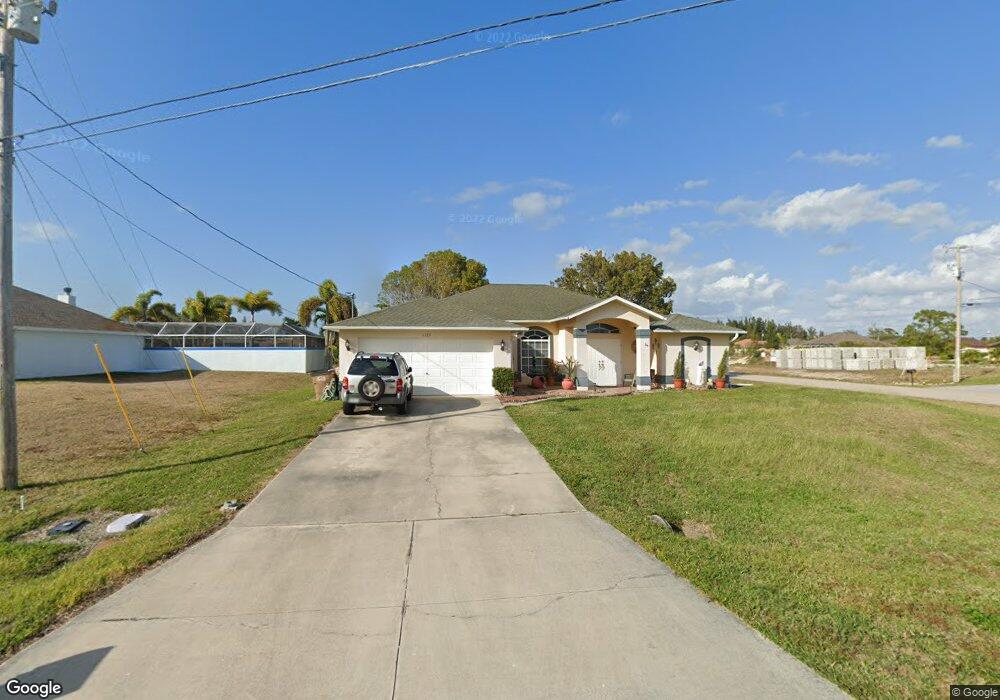
1723 SW 14th St Cape Coral, FL 33991
Trafalgar NeighborhoodEstimated Value: $323,426 - $424,000
4
Beds
2
Baths
2,432
Sq Ft
$154/Sq Ft
Est. Value
About This Home
This home is located at 1723 SW 14th St, Cape Coral, FL 33991 and is currently estimated at $375,107, approximately $154 per square foot. 1723 SW 14th St is a home located in Lee County with nearby schools including Caloosa Elementary School, Tropic Isles Elementary School, and Hancock Creek Elementary School.
Ownership History
Date
Name
Owned For
Owner Type
Purchase Details
Closed on
Aug 11, 2016
Sold by
Durango Holdings Llc
Bought by
Castellanos Ralph and Castellanos Brian
Current Estimated Value
Home Financials for this Owner
Home Financials are based on the most recent Mortgage that was taken out on this home.
Original Mortgage
$206,196
Outstanding Balance
$164,627
Interest Rate
3.5%
Mortgage Type
FHA
Estimated Equity
$210,480
Purchase Details
Closed on
Mar 25, 2016
Sold by
Mclandsborough William G
Bought by
Durango Holdings Llc
Purchase Details
Closed on
Sep 4, 2008
Sold by
King Doris C
Bought by
King Doris C
Purchase Details
Closed on
Jul 21, 2004
Sold by
Mignona Matthew and Radice Paul
Bought by
King Doris C
Purchase Details
Closed on
Jul 25, 2003
Sold by
Shoreland Holdings L L C
Bought by
Mignona Matthew and Radice Paul
Purchase Details
Closed on
May 8, 2003
Sold by
Farley Donibel F and Farley Richard F
Bought by
Shoreland Holdings L L C
Create a Home Valuation Report for This Property
The Home Valuation Report is an in-depth analysis detailing your home's value as well as a comparison with similar homes in the area
Home Values in the Area
Average Home Value in this Area
Purchase History
| Date | Buyer | Sale Price | Title Company |
|---|---|---|---|
| Castellanos Ralph | $210,000 | Town & Country Title Guarant | |
| Durango Holdings Llc | $146,700 | None Available | |
| King Doris C | -- | None Available | |
| King Doris C | $49,000 | Tri County Title Insurance A | |
| Mignona Matthew | $15,000 | -- | |
| Shoreland Holdings L L C | $4,500 | -- |
Source: Public Records
Mortgage History
| Date | Status | Borrower | Loan Amount |
|---|---|---|---|
| Open | Castellanos Ralph | $206,196 |
Source: Public Records
Tax History Compared to Growth
Tax History
| Year | Tax Paid | Tax Assessment Tax Assessment Total Assessment is a certain percentage of the fair market value that is determined by local assessors to be the total taxable value of land and additions on the property. | Land | Improvement |
|---|---|---|---|---|
| 2025 | $4,216 | $210,194 | -- | -- |
| 2024 | $4,094 | $204,270 | -- | -- |
| 2023 | $4,094 | $198,320 | $0 | $0 |
| 2022 | $3,870 | $192,544 | $0 | $0 |
| 2021 | $3,911 | $207,081 | $28,500 | $178,581 |
| 2020 | $3,941 | $184,355 | $0 | $0 |
| 2019 | $5,125 | $180,210 | $0 | $0 |
| 2018 | $5,089 | $176,850 | $20,000 | $156,850 |
| 2017 | $5,072 | $174,429 | $8,600 | $165,829 |
| 2016 | $5,358 | $161,870 | $8,600 | $153,270 |
| 2015 | $5,063 | $128,919 | $7,000 | $121,919 |
| 2014 | -- | $131,001 | $6,000 | $125,001 |
| 2013 | -- | $106,299 | $4,800 | $101,499 |
Source: Public Records
Map
Nearby Homes
- 1729 SW 14th St
- 1315 SW 17th Place
- 1416 SW 17th Ave
- 2114 SW 14th Terrace
- 1804 SW 13th Ln
- 1815 SW 13th Ln
- 1806 SW 13th St
- 1432 SW 17th Ave
- 1423 SW 17th Ave
- 1744 SW 15th St
- 1618 SW 14th St
- 1413 SW 19th Place
- 1502 SW 19th Ave
- 1617 SW 15th St
- 1628 SW 14th St
- 1214 SW 18th Ave
- 1704 SW 12th Terrace
- 1523 SW 16th Ct
- 1407 Chiquita Blvd S
- 525/531 Chiquita Blvd S
- 1333 SW 17th Place
- 1329 SW 17th Place
- 1337 SW 17th Place
- 1733 SW 14th St
- 1325 SW 17th Place
- 1320 SW 17th Place
- 1319 SW 18th Ave
- 1800 SW 13th Ln
- 1737 SW 14th St
- 1741 SW 14th St
- 1404 SW 17th Ave
- 1407 SW 17th Place
- 1328 SW 17th Ave
- 1408 SW 17th Ave
- 1324 SW 17th Ave
- 1311 SW 18th Ave
- 1412 SW 17th Ave
- 1414 SW 17th Ave
- 1414 SW 17th Place
- 1311 SW 17th Place