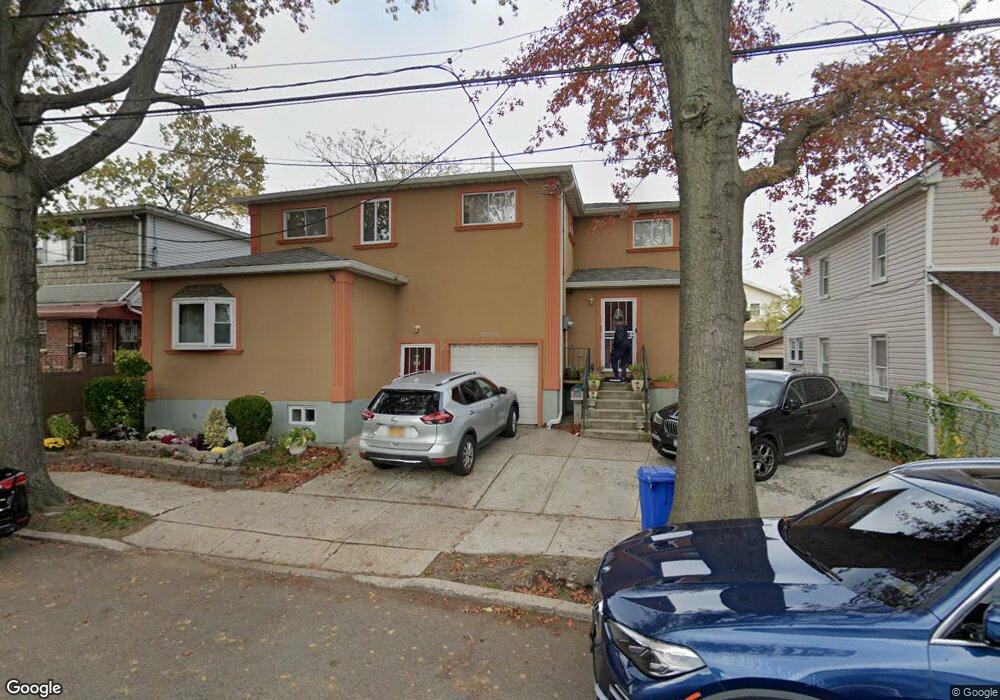
17231 126th Ave Jamaica, NY 11434
Saint Albans NeighborhoodEstimated Value: $830,010 - $1,151,000
--
Bed
--
Bath
1,860
Sq Ft
$522/Sq Ft
Est. Value
About This Home
This home is located at 17231 126th Ave, Jamaica, NY 11434 and is currently estimated at $970,253, approximately $521 per square foot. 17231 126th Ave is a home located in Queens County with nearby schools including The Jermaine L. Green STEM Institute of Queens, Catherine & Count Basie Middle School 72, and Rochdale Early Advantage Charter School.
Ownership History
Date
Name
Owned For
Owner Type
Purchase Details
Closed on
Jan 26, 2010
Sold by
Stanecky Michelle
Bought by
Henry Simone M
Current Estimated Value
Home Financials for this Owner
Home Financials are based on the most recent Mortgage that was taken out on this home.
Original Mortgage
$569,494
Outstanding Balance
$368,587
Interest Rate
4.75%
Mortgage Type
FHA
Estimated Equity
$601,666
Purchase Details
Closed on
Nov 21, 2008
Sold by
Clegg Roger
Bought by
Stanecky Michelle
Home Financials for this Owner
Home Financials are based on the most recent Mortgage that was taken out on this home.
Original Mortgage
$280,000
Interest Rate
6.11%
Mortgage Type
Purchase Money Mortgage
Purchase Details
Closed on
Sep 9, 1998
Sold by
Curry Platt and Curry Retha M
Bought by
Clegg Roger
Create a Home Valuation Report for This Property
The Home Valuation Report is an in-depth analysis detailing your home's value as well as a comparison with similar homes in the area
Home Values in the Area
Average Home Value in this Area
Purchase History
| Date | Buyer | Sale Price | Title Company |
|---|---|---|---|
| Henry Simone M | $580,000 | -- | |
| Henry Simone M | $580,000 | -- | |
| Stanecky Michelle | $360,000 | -- | |
| Stanecky Michelle | $360,000 | -- | |
| Clegg Roger | $70,000 | Commonwealth Land Title Ins | |
| Clegg Roger | $70,000 | Commonwealth Land Title Ins |
Source: Public Records
Mortgage History
| Date | Status | Borrower | Loan Amount |
|---|---|---|---|
| Open | Henry Simone M | $569,494 | |
| Closed | Henry Simone M | $569,494 | |
| Previous Owner | Stanecky Michelle | $280,000 |
Source: Public Records
Tax History Compared to Growth
Tax History
| Year | Tax Paid | Tax Assessment Tax Assessment Total Assessment is a certain percentage of the fair market value that is determined by local assessors to be the total taxable value of land and additions on the property. | Land | Improvement |
|---|---|---|---|---|
| 2025 | $6,436 | $33,966 | $8,170 | $25,796 |
| 2024 | $6,436 | $32,044 | $7,239 | $24,805 |
| 2023 | $6,408 | $31,906 | $7,360 | $24,546 |
| 2022 | $6,169 | $46,440 | $11,820 | $34,620 |
| 2021 | $6,304 | $42,180 | $11,820 | $30,360 |
| 2020 | $5,991 | $46,380 | $11,820 | $34,560 |
| 2019 | $5,586 | $39,720 | $11,820 | $27,900 |
| 2018 | $5,420 | $26,588 | $8,071 | $18,517 |
| 2017 | $5,249 | $25,750 | $10,502 | $15,248 |
| 2016 | $4,990 | $25,750 | $10,502 | $15,248 |
| 2015 | $2,930 | $23,588 | $9,752 | $13,836 |
| 2014 | $2,930 | $22,253 | $11,045 | $11,208 |
Source: Public Records
Map
Nearby Homes
- 125-11 172nd St
- 172-44 126th Ave
- 172-40 125th Ave
- 172-21 Baisley Blvd
- 173-33 Vaswani Ave
- 12030 172nd St
- 172-38 Brocher Rd
- 17204 Amelia Rd
- 174-17 129th Ave
- 55 128th Ave
- 174-63 128th Ave
- 119-73 Merrill St
- 174-41 125th Ave
- 12126 Irwin Place
- 169-29 120th Ave
- 16929 120th Ave
- 176-15 130th Ave
- 17710 Troutville Rd
- 17715 Troutville Rd
- 176-27 Sunbury Rd
- 172-37 126th Ave
- 17237 126th Ave
- 17229 126th Ave
- 172-29 126th Ave Unit 1
- 172-29 126th Ave Unit 2
- 172-29 126th Ave
- 172-25 126th Ave
- 172-34 125th Ave
- 17225 126th Ave
- 17234 125th Ave
- 172-38 125th Ave
- 17230 125th Ave
- 172-43 126th Ave Unit 1st Fl
- 172-43 126th Ave Unit 2nd Fl
- 172-43 126th Ave
- 17243 126th Ave
- 17226 125th Ave
- 17240 125th Ave
- 172-21 126th Ave
- 172-26 125th Ave