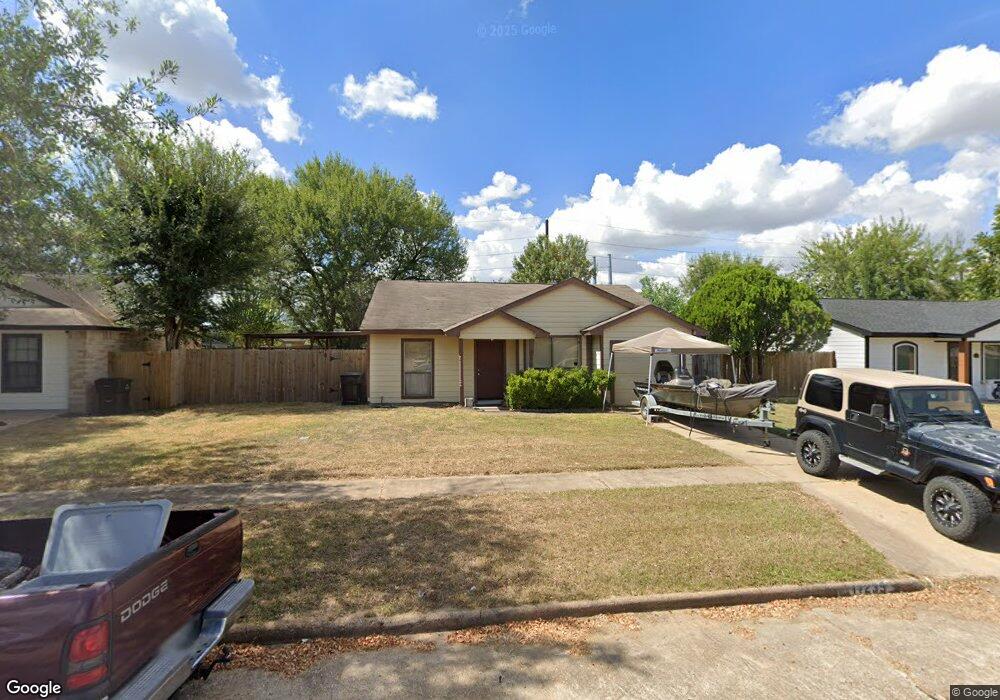
17235 Wagganner Dr Hockley, TX 77447
Hockley NeighborhoodEstimated Value: $172,000 - $190,000
2
Beds
2
Baths
1,013
Sq Ft
$178/Sq Ft
Est. Value
About This Home
This home is located at 17235 Wagganner Dr, Hockley, TX 77447 and is currently estimated at $180,607, approximately $178 per square foot. 17235 Wagganner Dr is a home located in Harris County with nearby schools including Roberts Road Elementary School, Waller Junior High School, and Waller High School.
Ownership History
Date
Name
Owned For
Owner Type
Purchase Details
Closed on
Jun 6, 2013
Sold by
Pariza Mary E and Estate Of Bruce Allan Richards
Bought by
Pariza Mary E and Top Bar Trust
Current Estimated Value
Purchase Details
Closed on
Feb 28, 2005
Sold by
Hud
Bought by
Richards Bruce A
Purchase Details
Closed on
Nov 12, 2004
Sold by
Chase Manhattan Mortgage Corp
Bought by
Hud
Purchase Details
Closed on
Jun 1, 2004
Sold by
Bates Kristy M
Bought by
Chase Manhattan Mortgage Corp
Purchase Details
Closed on
Jun 6, 2002
Sold by
Arratia Rosa M
Bought by
Bates Kristy M
Home Financials for this Owner
Home Financials are based on the most recent Mortgage that was taken out on this home.
Original Mortgage
$44,602
Interest Rate
6.77%
Mortgage Type
FHA
Purchase Details
Closed on
Oct 3, 1994
Sold by
Rogo Usa Inc
Bought by
Villarreal Enrique R
Create a Home Valuation Report for This Property
The Home Valuation Report is an in-depth analysis detailing your home's value as well as a comparison with similar homes in the area
Home Values in the Area
Average Home Value in this Area
Purchase History
| Date | Buyer | Sale Price | Title Company |
|---|---|---|---|
| Pariza Mary E | -- | None Available | |
| Richards Bruce A | -- | First American Title | |
| Hud | -- | -- | |
| Chase Manhattan Mortgage Corp | $47,517 | -- | |
| Bates Kristy M | -- | Chicago Title | |
| Villarreal Enrique R | -- | American Title Company |
Source: Public Records
Mortgage History
| Date | Status | Borrower | Loan Amount |
|---|---|---|---|
| Previous Owner | Bates Kristy M | $44,602 |
Source: Public Records
Tax History Compared to Growth
Tax History
| Year | Tax Paid | Tax Assessment Tax Assessment Total Assessment is a certain percentage of the fair market value that is determined by local assessors to be the total taxable value of land and additions on the property. | Land | Improvement |
|---|---|---|---|---|
| 2025 | $4,034 | $168,340 | $34,708 | $133,632 |
| 2024 | $4,034 | $162,300 | $34,708 | $127,592 |
| 2023 | $4,034 | $164,263 | $34,708 | $129,555 |
| 2022 | $3,858 | $144,487 | $34,708 | $109,779 |
| 2021 | $3,296 | $117,913 | $28,397 | $89,516 |
| 2020 | $3,059 | $105,969 | $26,820 | $79,149 |
| 2019 | $2,567 | $86,000 | $22,087 | $63,913 |
| 2018 | $535 | $64,000 | $22,087 | $41,913 |
| 2017 | $2,098 | $84,094 | $22,087 | $62,007 |
| 2016 | $2,088 | $70,666 | $22,087 | $48,579 |
| 2015 | $479 | $68,660 | $15,145 | $53,515 |
| 2014 | $479 | $46,240 | $15,145 | $31,095 |
Source: Public Records
Map
Nearby Homes
- 2076 Stallion Lakes Ave
- 24503 Wild Horse Ln
- 17247 Osprey Forest Dr
- 24303 Four Sixes Ln
- 24402 Bar Kay Ln
- 24402 Jumping Jay Dr
- 24231 Wild Horse Ln
- 24211 Four Sixes Ln
- 24310 Rockin Seven Dr
- 0 Lazy Kay Ln
- 17222 Osprey Landing Dr
- 24414 Broken Bow Ln
- 17506 Bullis Gap Dr
- 17135 Falcons Nest Landing Dr
- 24335 Palm Cockatoo Dr
- 24039 Rockin Seven Dr
- 24519 Cypresspark Glen Ln
- 17607 Lavender Blossom Ln
- 17419 Lavender Blossom Ln
- 17423 Lavender Blossom Ln
- 17231 Wagganner Dr
- 17303 Wagganner Dr
- 17422 Cedar Rock Dr
- 17418 Cedar Rock Dr
- 17227 Wagganner Dr
- 17307 Wagganner Dr
- 17426 Cedar Rock Dr
- 17430 Cedar Rock Dr
- 24410 Four Sixes Ln
- 24411 Four Sixes Ln
- 17434 Cedar Rock Dr
- 17223 Wagganner Dr
- 24406 Four Sixes Ln
- 17438 Cedar Rock Dr
- 24427 Running Iron Dr
- 24407 Four Sixes Ln
- 17219 Wagganner Dr
- 24410 Kennedy Ranch Ln
- 17334 Osprey Forest Dr
- 2212 Stallion Lakes Ave