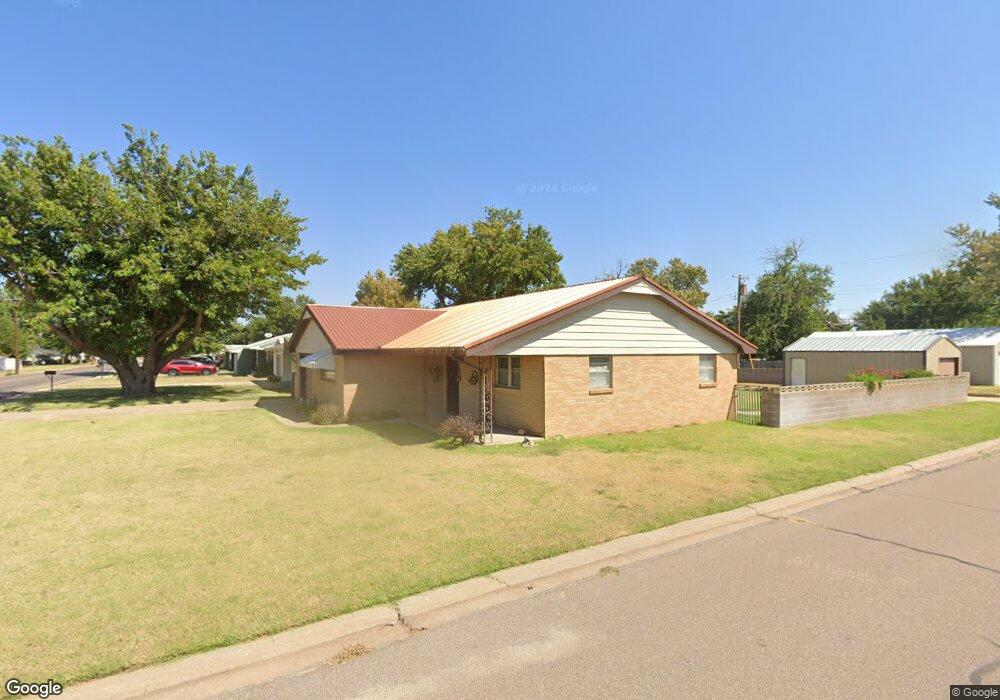
1724 22nd St Woodward, OK 73801
Estimated Value: $100,000 - $113,000
2
Beds
1
Bath
1,320
Sq Ft
$81/Sq Ft
Est. Value
About This Home
This home is located at 1724 22nd St, Woodward, OK 73801 and is currently estimated at $106,834, approximately $80 per square foot. 1724 22nd St is a home located in Woodward County with nearby schools including Woodward High School and Woodward Christian Academy.
Ownership History
Date
Name
Owned For
Owner Type
Purchase Details
Closed on
Sep 10, 2025
Sold by
Mcnaught Connie D
Bought by
Mcnaught Connie D and Mcnaught Damon D
Current Estimated Value
Purchase Details
Closed on
Oct 17, 2020
Sold by
Sloas Nickie Ray
Bought by
Mcnaught Connie and Mcnaught Teddy
Purchase Details
Closed on
Sep 23, 2020
Sold by
Sloas Nickie Ray
Bought by
Mcnaught Connie and Mcnaught Teddy
Purchase Details
Closed on
Sep 20, 2007
Sold by
Kline Colvetta
Bought by
Kline Clovetta and Clovetta Kline Revocable Trust
Purchase Details
Closed on
Dec 19, 2005
Sold by
Mcnaught Connie
Bought by
Kline Clovetta
Create a Home Valuation Report for This Property
The Home Valuation Report is an in-depth analysis detailing your home's value as well as a comparison with similar homes in the area
Home Values in the Area
Average Home Value in this Area
Purchase History
| Date | Buyer | Sale Price | Title Company |
|---|---|---|---|
| Mcnaught Connie D | -- | None Listed On Document | |
| Mcnaught Connie | -- | None Available | |
| Mcnaught Connie | $87,000 | None Available | |
| Kline Clovetta | -- | -- | |
| Kline Clovetta | -- | -- |
Source: Public Records
Tax History Compared to Growth
Tax History
| Year | Tax Paid | Tax Assessment Tax Assessment Total Assessment is a certain percentage of the fair market value that is determined by local assessors to be the total taxable value of land and additions on the property. | Land | Improvement |
|---|---|---|---|---|
| 2024 | $274 | $4,008 | $437 | $3,571 |
| 2023 | $274 | $4,008 | $469 | $3,539 |
| 2022 | $279 | $4,008 | $496 | $3,512 |
| 2021 | $362 | $4,008 | $399 | $3,609 |
| 2020 | $183 | $4,008 | $399 | $3,609 |
| 2019 | $179 | $4,008 | $1 | $4,007 |
| 2018 | $182 | $4,008 | $1 | $4,007 |
| 2017 | $334 | $4,720 | $713 | $4,007 |
| 2016 | $338 | $4,720 | $713 | $4,007 |
| 2015 | $393 | $5,493 | $713 | $4,780 |
| 2014 | $325 | $4,720 | $713 | $4,007 |
Source: Public Records
Map
Nearby Homes