Estimated Value: $4,526,000 - $8,504,000
2
Beds
5
Baths
4,258
Sq Ft
$1,684/Sq Ft
Est. Value
About This Home
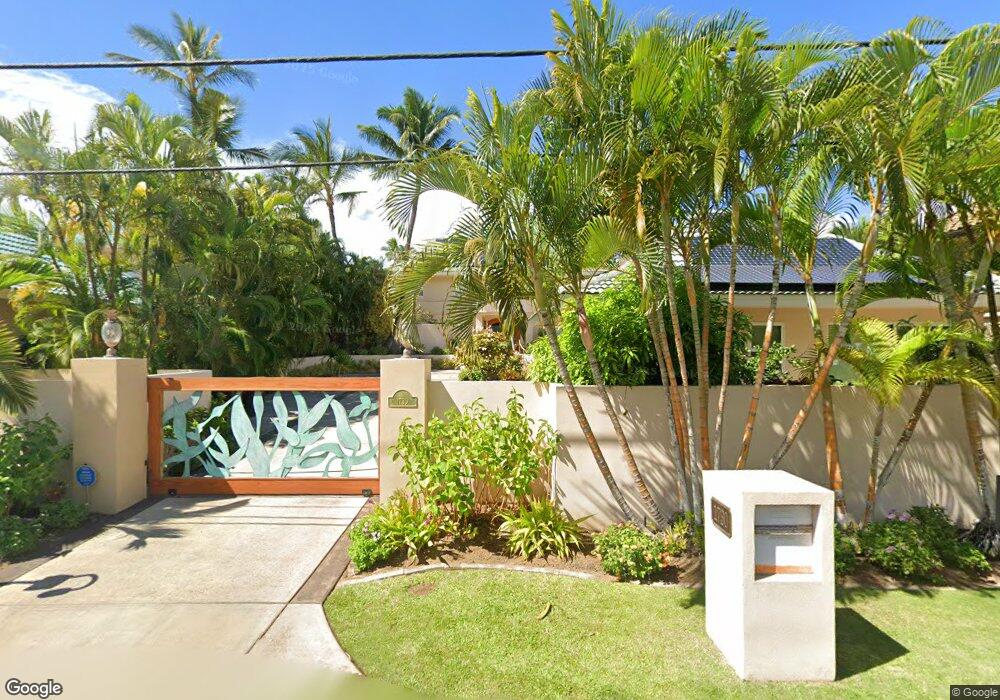
This home is located at 1724 Halama St, Kihei, HI 96753 and is currently estimated at $7,169,827, approximately $1,683 per square foot. 1724 Halama St is a home located in Maui County with nearby schools including Kamali'i Elementary School, Lokelani Intermediate School, and Maui High School.
Ownership History
Date
Name
Owned For
Owner Type
Purchase Details
Closed on
Sep 19, 2016
Sold by
Dunn Roy E
Bought by
Dunn Roy
Current Estimated Value
Purchase Details
Closed on
Oct 7, 2011
Sold by
Wagner Carolyn Rixey and Rixey Thomas D
Bought by
Dunn Roy E
Purchase Details
Closed on
Oct 28, 2002
Sold by
Makekau Stanley N B and Makekau Stanley
Bought by
Makekau Jeffery N
Purchase Details
Closed on
Dec 20, 2000
Sold by
Rixey Thomas D
Bought by
Rixey Family Partnership
Purchase Details
Closed on
Aug 4, 2000
Sold by
Rixey Thomas D
Bought by
Rixey Thomas D and The Thomas D Rixey Trust
Purchase Details
Closed on
Oct 22, 1997
Sold by
Denning Patricia S
Bought by
Rixey Thomas D
Purchase Details
Closed on
Oct 21, 1997
Sold by
Denning Patricia S and Leffingwell Patricia S
Bought by
Denning Patricia S
Create a Home Valuation Report for This Property
The Home Valuation Report is an in-depth analysis detailing your home's value as well as a comparison with similar homes in the area
Home Values in the Area
Average Home Value in this Area
Purchase History
| Date | Buyer | Sale Price | Title Company |
|---|---|---|---|
| Dunn Roy | -- | Accommodation | |
| Dunn Roy E | $2,200,000 | Tg | |
| Makekau Jeffery N | -- | -- | |
| Rixey Family Partnership | $1,265,600 | -- | |
| Rixey Thomas D | -- | -- | |
| Rixey Thomas D | $900,000 | -- | |
| Denning Patricia S | -- | -- |
Source: Public Records
Tax History Compared to Growth
Tax History
| Year | Tax Paid | Tax Assessment Tax Assessment Total Assessment is a certain percentage of the fair market value that is determined by local assessors to be the total taxable value of land and additions on the property. | Land | Improvement |
|---|---|---|---|---|
| 2025 | $20,552 | $8,948,000 | $5,804,700 | $3,143,300 |
| 2024 | $20,552 | $7,839,200 | $4,837,300 | $3,001,900 |
| 2023 | $15,482 | $6,784,300 | $3,773,100 | $3,011,200 |
| 2022 | $14,389 | $6,221,600 | $3,482,800 | $2,738,800 |
| 2021 | $14,695 | $5,762,800 | $3,192,600 | $2,570,200 |
| 2020 | $15,680 | $6,251,600 | $3,598,900 | $2,652,700 |
| 2019 | $16,166 | $5,774,600 | $3,192,600 | $2,582,000 |
| 2018 | $15,712 | $5,713,100 | $3,579,600 | $2,133,500 |
| 2017 | $14,382 | $0 | $0 | $0 |
| 2016 | $14,748 | $5,662,400 | $3,676,300 | $1,986,100 |
| 2015 | -- | $5,007,700 | $3,192,600 | $1,815,100 |
Source: Public Records
Map
Nearby Homes
- 1756 Halama St
- 1656 Halama St
- 86 Waipahe St
- 72 Kupuna St
- 98 Mehani Place
- 87 Miha Place
- 98 E Welakahao Rd
- 139 Mehani Place
- 70 Halelani Place
- 138 Kupuna St
- 1450 S Kihei Rd Unit A205
- 1450 S Kihei Rd Unit C204
- 47 W Kapu Place Unit B
- 143 Keala Place Unit C
- 1993 S Kihei Rd Unit 311
- 1993 S Kihei Rd Unit 600
- 1993 S Kihei Rd Unit 512
- 1993 S Kihei Rd Unit 202
- 142 Keala Place
- 2037 S Kihei Rd Unit 16
- 1718 Halama St
- 1716 Halama St
- 1730 Halama St
- 1710 Halama St
- 1736 Halama St
- 1750 Halama St
- 1727 Halama St
- 1733 Halama St
- 1729 Halama St
- 1711 Halama St
- 1721 Halama St
- 1735 Halama St
- 1745 Halama St
- 1701 Halama St
- 1731 Halama St
- 1731 Halama St Unit 62
- 1731 Halama St Unit 64
- 1688 Halama St Unit C669
- 1688 Halama St Unit B
- 1764 Halama St