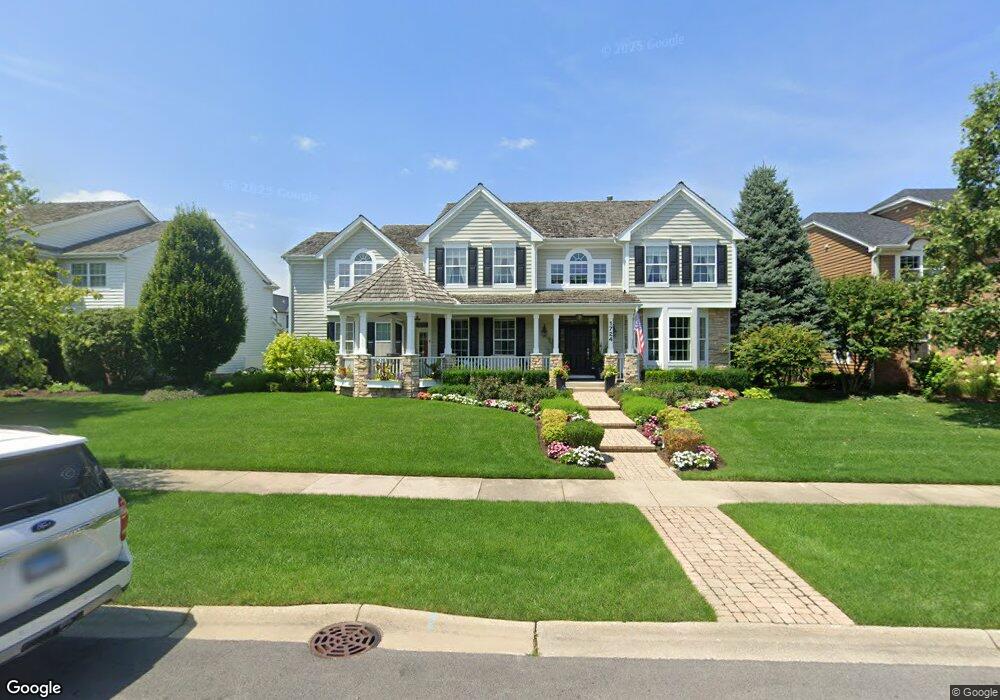
1724 Independence Ave Glenview, IL 60026
The Glen NeighborhoodEstimated Value: $1,452,000 - $1,742,000
4
Beds
3
Baths
3,953
Sq Ft
$403/Sq Ft
Est. Value
About This Home
This home is located at 1724 Independence Ave, Glenview, IL 60026 and is currently estimated at $1,591,366, approximately $402 per square foot. 1724 Independence Ave is a home located in Cook County with nearby schools including Westbrook Elementary School, Glen Grove Elementary School, and Attea Middle School.
Ownership History
Date
Name
Owned For
Owner Type
Purchase Details
Closed on
Jan 11, 2017
Sold by
Welch Douglas B and Welch Laura L
Bought by
Welch Douglas B and Douglas B Welch Revocable Trust
Current Estimated Value
Purchase Details
Closed on
Jan 31, 2001
Sold by
Chapel Crossing Ltd Partnership
Bought by
Welch Douglas B and Welch Laura L
Home Financials for this Owner
Home Financials are based on the most recent Mortgage that was taken out on this home.
Original Mortgage
$650,000
Outstanding Balance
$226,499
Interest Rate
7.12%
Estimated Equity
$1,364,867
Create a Home Valuation Report for This Property
The Home Valuation Report is an in-depth analysis detailing your home's value as well as a comparison with similar homes in the area
Home Values in the Area
Average Home Value in this Area
Purchase History
| Date | Buyer | Sale Price | Title Company |
|---|---|---|---|
| Welch Douglas B | -- | None Available | |
| Welch Douglas B | $809,000 | -- |
Source: Public Records
Mortgage History
| Date | Status | Borrower | Loan Amount |
|---|---|---|---|
| Open | Welch Douglas B | $650,000 |
Source: Public Records
Tax History
| Year | Tax Paid | Tax Assessment Tax Assessment Total Assessment is a certain percentage of the fair market value that is determined by local assessors to be the total taxable value of land and additions on the property. | Land | Improvement |
|---|---|---|---|---|
| 2025 | $20,536 | $142,000 | $32,093 | $109,907 |
| 2024 | $21,924 | $96,100 | $27,198 | $68,902 |
| 2023 | $21,924 | $96,100 | $27,198 | $68,902 |
| 2022 | $21,924 | $105,350 | $27,198 | $78,152 |
| 2021 | $20,374 | $85,190 | $13,054 | $72,136 |
| 2020 | $20,189 | $85,190 | $13,054 | $72,136 |
| 2019 | $18,811 | $93,616 | $13,054 | $80,562 |
| 2018 | $19,965 | $90,244 | $11,422 | $78,822 |
| 2017 | $19,447 | $90,244 | $11,422 | $78,822 |
| 2016 | $18,971 | $92,182 | $11,422 | $80,760 |
| 2015 | $17,816 | $77,436 | $9,247 | $68,189 |
| 2014 | $17,502 | $77,436 | $9,247 | $68,189 |
| 2013 | $16,955 | $77,436 | $9,247 | $68,189 |
Source: Public Records
Map
Nearby Homes
- 1619 Patriot Blvd
- 1813 Admiral Ct Unit 118
- 2701 Commons Dr Unit 210
- 2020 Chestnut Ave Unit 312
- 2132 Rugen Rd Unit E
- 2000 Chestnut Ave Unit 103
- 2000 Chestnut Ave Unit 407
- 2710 Langley Cir Unit 201003
- 1855 Tanglewood Dr Unit F
- 1809 Jefferson Ave
- 2531 Violet St
- 2238 Prairie St
- 2464 Violet St
- 1774 Rogers Ave
- 1220 Depot St Unit 305
- 1700 Independence Ave
- 1701 Annapolis Dr
- 1749 Annapolis Dr
- 1698 Independence Ave
- 1699 Annapolis Dr
- 1682 Independence Ave
- 2374 Fielding Dr
- 2386 Fielding Dr
- 1717 Independence Ave
- 1733 Independence Ave
- 2350 Fielding Dr
- 1701 Independence Ave
- 1679 Annapolis Dr
- 1749 Independence Ave
- 1724 Annapolis Dr
- 1699 Independence Ave
- 1748 Annapolis Dr
- 1700 Annapolis Dr
- 1666 Independence Ave
- 2338 Fielding Dr
Your Personal Tour Guide
Ask me questions while you tour the home.