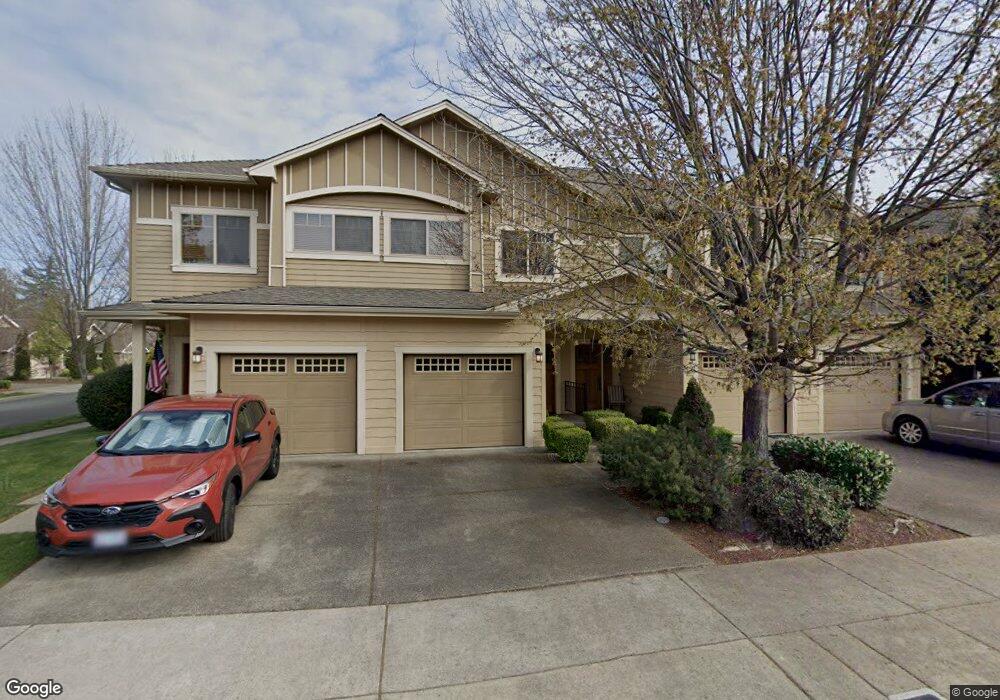
1724 Kids Way Unit 41 Grants Pass, OR 97526
Estimated Value: $285,568 - $341,000
2
Beds
3
Baths
1,318
Sq Ft
$238/Sq Ft
Est. Value
About This Home
This home is located at 1724 Kids Way Unit 41, Grants Pass, OR 97526 and is currently estimated at $313,284, approximately $237 per square foot. 1724 Kids Way Unit 41 is a home located in Josephine County with nearby schools including Riverside Elementary School, South Middle School, and Grants Pass High School.
Ownership History
Date
Name
Owned For
Owner Type
Purchase Details
Closed on
Jul 17, 2009
Sold by
Sequoia Village Llc
Bought by
Forbes Andrew B and Forbes Janet K
Current Estimated Value
Home Financials for this Owner
Home Financials are based on the most recent Mortgage that was taken out on this home.
Original Mortgage
$146,900
Outstanding Balance
$95,191
Interest Rate
5.25%
Mortgage Type
Purchase Money Mortgage
Estimated Equity
$218,093
Purchase Details
Closed on
May 8, 2009
Sold by
Charbonneau Properties Llc
Bought by
Sequoia Village Llc
Purchase Details
Closed on
Aug 27, 2007
Sold by
Sequoia Village Llc
Bought by
Charbonneau Daniel
Home Financials for this Owner
Home Financials are based on the most recent Mortgage that was taken out on this home.
Original Mortgage
$125,000
Interest Rate
6.74%
Mortgage Type
Purchase Money Mortgage
Create a Home Valuation Report for This Property
The Home Valuation Report is an in-depth analysis detailing your home's value as well as a comparison with similar homes in the area
Home Values in the Area
Average Home Value in this Area
Purchase History
| Date | Buyer | Sale Price | Title Company |
|---|---|---|---|
| Forbes Andrew B | $196,500 | Multiple | |
| Sequoia Village Llc | -- | None Available | |
| Charbonneau Daniel | $223,000 | Multiple |
Source: Public Records
Mortgage History
| Date | Status | Borrower | Loan Amount |
|---|---|---|---|
| Open | Forbes Andrew B | $146,900 | |
| Previous Owner | Charbonneau Daniel | $125,000 |
Source: Public Records
Tax History Compared to Growth
Tax History
| Year | Tax Paid | Tax Assessment Tax Assessment Total Assessment is a certain percentage of the fair market value that is determined by local assessors to be the total taxable value of land and additions on the property. | Land | Improvement |
|---|---|---|---|---|
| 2025 | $2,476 | $190,660 | -- | -- |
| 2024 | $2,476 | $185,110 | -- | -- |
| 2023 | $2,332 | $179,720 | $0 | $0 |
| 2022 | $2,343 | $174,490 | -- | -- |
| 2021 | $2,201 | $169,410 | $0 | $0 |
| 2020 | $2,137 | $164,480 | $0 | $0 |
| 2019 | $2,075 | $159,690 | $0 | $0 |
| 2018 | $2,112 | $155,040 | $0 | $0 |
| 2017 | $2,096 | $150,530 | $0 | $0 |
| 2016 | $1,843 | $146,150 | $0 | $0 |
| 2015 | $1,746 | $141,900 | $0 | $0 |
| 2014 | $1,734 | $137,770 | $0 | $0 |
Source: Public Records
Map
Nearby Homes
- 1708 Softwood Way
- 1034 SE Camelot Dr
- 1004 SE Camelot Dr
- 2024 Kayleigh Way
- 1455 SE Rogue Dr
- 905 SE Fern St
- 1035 SE Ashley Place
- 1060 SE Oriole St
- 2250 Rogue River Hwy
- 2215 SE Portola Dr
- 1059 SE Belle Aire Dr
- 1275 E Park St
- 1461 Rogue River Hwy
- 1201 E Park St
- 1195 E Park St
- 2060 NE Fairview Ave
- 1665 Fruitdale Dr
- 1405 NE Laura Ct
- 900 SE Mystic Dr
- 861 SE M St
- 1118 SE Kids Way Unit Lot48
- 1722 SE Kids Way
- 1722 Kids Way Unit Lot40
- 1722 Kids Way
- 1724 Kids Way
- 1726 Kids Way Unit Lot42
- 1726 Kids Way
- 1728 Kids Way
- 1728 Kids Way Unit 43
- 1119 Catherine Way Unit Lot39
- 1119 Catherine Way
- 1730 Kids Way
- 1730 Kids Way Unit 44
- 1117 Catherine Way
- 1117 Catherine Way Unit 38
- 1117 Catherine Way Unit Lot37
- 1115 Catherine Way
- 1115 Catherine Way Unit Lot37
- 1732 Kids Way
- 1732 Kids Way Unit 45