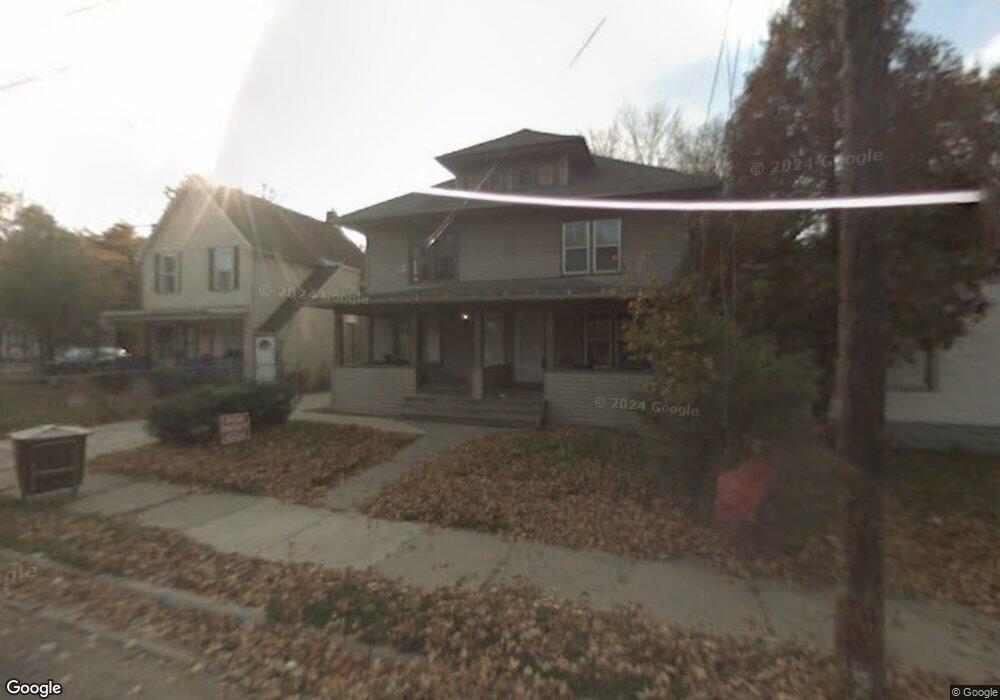
1724 Linval St Lansing, MI 48910
Fabulous Acres NeighborhoodEstimated Value: $145,000 - $173,251
Studio
--
Bath
2,304
Sq Ft
$68/Sq Ft
Est. Value
About This Home
This home is located at 1724 Linval St, Lansing, MI 48910 and is currently estimated at $157,563, approximately $68 per square foot. 1724 Linval St is a home located in Ingham County with nearby schools including Lyons Elementary School, Pattengill Academy, and Eastern High School.
Ownership History
Date
Name
Owned For
Owner Type
Purchase Details
Closed on
Jul 31, 2013
Sold by
Lee Lonnie C and Lee Precious D
Bought by
Joy Bobby
Current Estimated Value
Purchase Details
Closed on
Sep 30, 2003
Sold by
Jackson Ruby
Bought by
Lee Lonnie C and Lee Precious D
Home Financials for this Owner
Home Financials are based on the most recent Mortgage that was taken out on this home.
Original Mortgage
$65,520
Interest Rate
6.01%
Mortgage Type
Purchase Money Mortgage
Purchase Details
Closed on
Jun 19, 2000
Sold by
Lindsay Richard A and Lindsay Joan E
Bought by
Joy Bobby
Create a Home Valuation Report for This Property
The Home Valuation Report is an in-depth analysis detailing your home's value as well as a comparison with similar homes in the area
Home Values in the Area
Average Home Value in this Area
Purchase History
| Date | Buyer | Sale Price | Title Company |
|---|---|---|---|
| Joy Bobby | $1,500 | None Available | |
| Lee Lonnie C | $72,800 | Bell Title | |
| Joy Bobby | $45,000 | -- |
Source: Public Records
Mortgage History
| Date | Status | Borrower | Loan Amount |
|---|---|---|---|
| Previous Owner | Lee Lonnie C | $65,520 |
Source: Public Records
Tax History Compared to Growth
Tax History
| Year | Tax Paid | Tax Assessment Tax Assessment Total Assessment is a certain percentage of the fair market value that is determined by local assessors to be the total taxable value of land and additions on the property. | Land | Improvement |
|---|---|---|---|---|
| 2025 | $3,012 | $80,200 | $3,200 | $77,000 |
| 2024 | $23 | $60,900 | $3,200 | $57,700 |
| 2023 | $2,835 | $53,800 | $3,200 | $50,600 |
| 2022 | $2,658 | $50,200 | $2,700 | $47,500 |
| 2021 | $4,024 | $44,500 | $2,600 | $41,900 |
| 2020 | $2,508 | $41,000 | $2,600 | $38,400 |
| 2019 | $4,216 | $37,100 | $2,600 | $34,500 |
| 2018 | $2,279 | $32,300 | $2,600 | $29,700 |
| 2017 | $2,186 | $32,300 | $2,600 | $29,700 |
| 2016 | $3,971 | $31,700 | $2,600 | $29,100 |
| 2015 | $3,971 | $30,800 | $5,247 | $25,553 |
| 2014 | $3,971 | $31,300 | $4,036 | $27,264 |
Source: Public Records
Map
Nearby Homes
- 616 Isbell St
- 619 E Mount Hope Ave
- 707 Isbell St
- 1818 Ray St
- 525 E Mount Hope Ave
- 531 Torrence Ct
- 1731 Herbert St
- 704 Mckim Ave
- 612 Baker St
- 1718 Donora St
- 315 E Mount Hope Ave
- 520 Christiancy St
- 512 Woodrow Ave
- 514 Christiancy St
- 147 Isbell St
- 841 Baker St
- 1437 Ada St
- 1807 Teel Ave
- 2208 Lyons Ave
- 909 Baker St