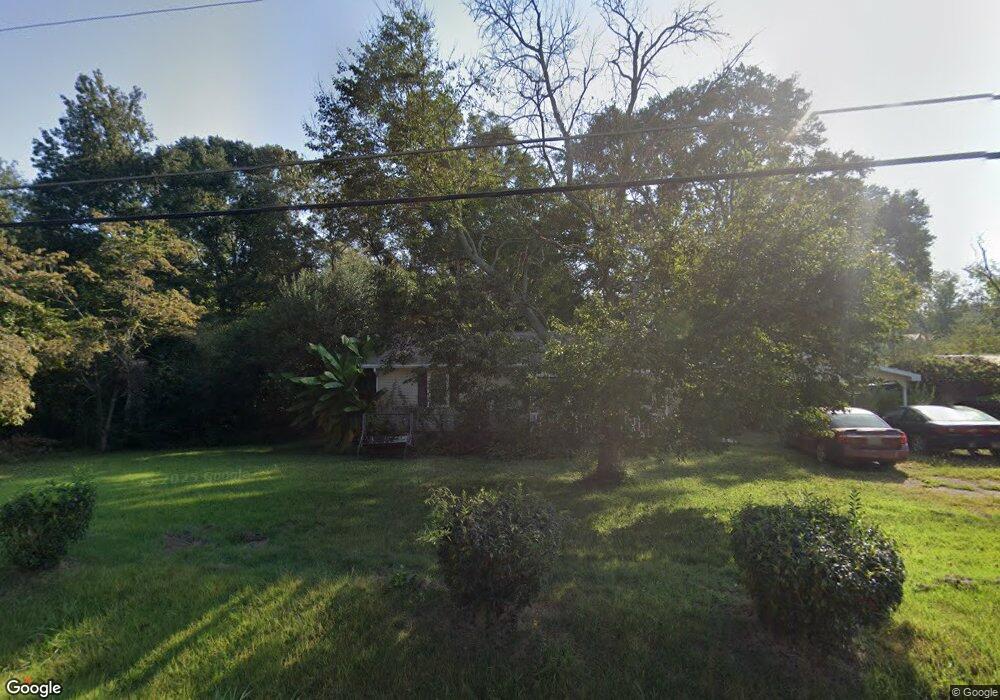
1724 Lowell Rd Carrollton, GA 30116
Estimated Value: $178,000 - $259,000
2
Beds
2
Baths
1,058
Sq Ft
$205/Sq Ft
Est. Value
About This Home
This home is located at 1724 Lowell Rd, Carrollton, GA 30116 and is currently estimated at $216,959, approximately $205 per square foot. 1724 Lowell Rd is a home located in Carroll County with nearby schools including Roopville Elementary School, Central Middle School, and Central High School.
Ownership History
Date
Name
Owned For
Owner Type
Purchase Details
Closed on
Aug 4, 2009
Sold by
Rainwater Jessie T
Bought by
Buchanan Randy
Current Estimated Value
Home Financials for this Owner
Home Financials are based on the most recent Mortgage that was taken out on this home.
Original Mortgage
$112,998
Outstanding Balance
$73,600
Interest Rate
5.19%
Mortgage Type
FHA
Estimated Equity
$143,359
Purchase Details
Closed on
Sep 28, 2007
Sold by
Ebensberger Andrew
Bought by
Rainwater Jesse T and Rainwater Sybill Rae
Purchase Details
Closed on
Dec 5, 2001
Sold by
Morris C Chadwick
Bought by
Ebensberger Andrew J and Ebensberger Kristen L
Purchase Details
Closed on
Feb 19, 1998
Sold by
Morris Sandra S
Bought by
Morris C Chadwick
Purchase Details
Closed on
Sep 17, 1997
Sold by
Morris Comer Chadwic
Bought by
Morris Sandra S
Purchase Details
Closed on
Jul 3, 1997
Sold by
Morris Sandra
Bought by
Morris Comer Chadwic
Purchase Details
Closed on
Jul 24, 1990
Bought by
Morris Sandra
Create a Home Valuation Report for This Property
The Home Valuation Report is an in-depth analysis detailing your home's value as well as a comparison with similar homes in the area
Home Values in the Area
Average Home Value in this Area
Purchase History
| Date | Buyer | Sale Price | Title Company |
|---|---|---|---|
| Buchanan Randy | $116,900 | -- | |
| Rainwater Jesse T | $108,500 | -- | |
| Ebensberger Andrew J | $85,000 | -- | |
| Morris C Chadwick | $5,200 | -- | |
| Morris Sandra S | -- | -- | |
| Morris Comer Chadwic | $65,000 | -- | |
| Morris Sandra | -- | -- |
Source: Public Records
Mortgage History
| Date | Status | Borrower | Loan Amount |
|---|---|---|---|
| Open | Buchanan Randy | $112,998 |
Source: Public Records
Tax History Compared to Growth
Tax History
| Year | Tax Paid | Tax Assessment Tax Assessment Total Assessment is a certain percentage of the fair market value that is determined by local assessors to be the total taxable value of land and additions on the property. | Land | Improvement |
|---|---|---|---|---|
| 2024 | $178 | $50,360 | $9,295 | $41,065 |
| 2023 | $178 | $45,045 | $7,436 | $37,609 |
| 2022 | $781 | $35,140 | $4,958 | $30,182 |
| 2021 | $672 | $30,205 | $3,966 | $26,239 |
| 2020 | $587 | $26,881 | $3,605 | $23,276 |
| 2019 | $540 | $24,884 | $3,605 | $21,279 |
| 2018 | $491 | $22,692 | $3,370 | $19,322 |
| 2017 | $492 | $22,692 | $3,370 | $19,322 |
| 2016 | $493 | $22,692 | $3,370 | $19,322 |
| 2015 | $893 | $35,925 | $10,000 | $25,925 |
| 2014 | $897 | $35,925 | $10,000 | $25,925 |
Source: Public Records
Map
Nearby Homes
- 1725 Lowell Rd
- 1700 Lowell Rd
- 2728 E Highway 5
- 2452 E Highway 5
- 1651 Lowell Rd
- 2732 E Highway 5
- 201 Lowell Ln
- 151 Lowell Ln
- 2752 E Highway 5
- 47 Liberty Church Rd
- 232 Lowell Ln
- 246 Lowell Ln
- 237 Lowell Ln
- 52 Liberty Church Rd
- 1648 Lowell Rd
- 1532 Lowell Rd
- 105 Liberty Church Rd
- 284 Lowell Ln
- 3011 Clem Lowell Rd
- 2800 E Highway 5