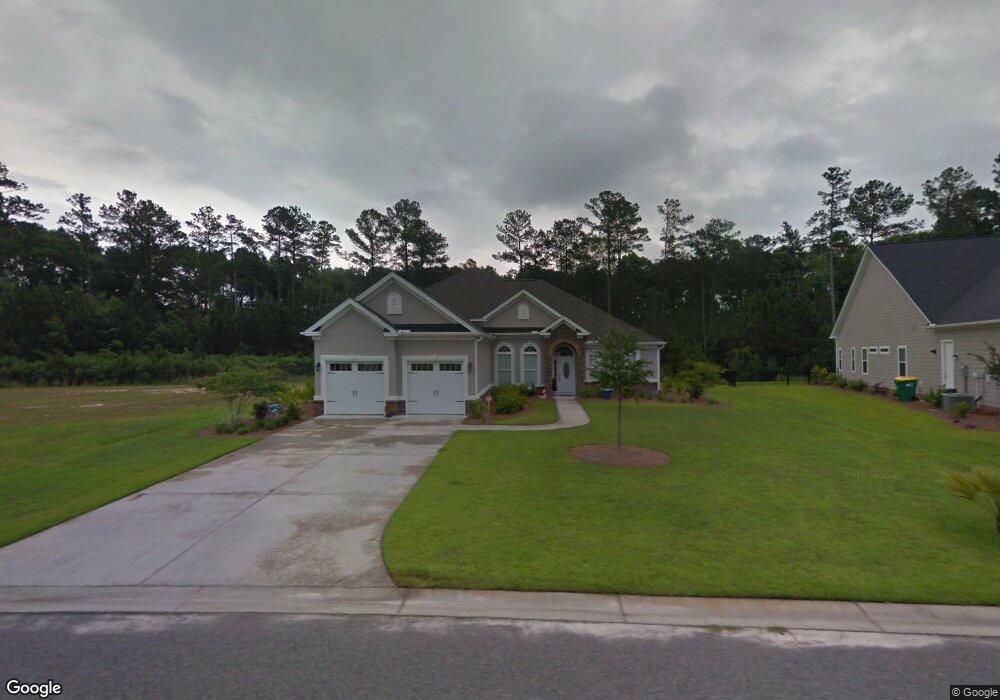
1724 Wiregrass Way Hardeeville, SC 29927
Estimated Value: $536,407 - $631,000
--
Bed
--
Bath
2,311
Sq Ft
$255/Sq Ft
Est. Value
About This Home
This home is located at 1724 Wiregrass Way, Hardeeville, SC 29927 and is currently estimated at $588,602, approximately $254 per square foot. 1724 Wiregrass Way is a home located in Jasper County with nearby schools including Hardeeville Elementary School, Hardeeville Junior & Senior High School, and Ridgeland Secondary Academy Of Excellence.
Ownership History
Date
Name
Owned For
Owner Type
Purchase Details
Closed on
Jun 5, 2013
Sold by
Realstar Limited Llc
Bought by
Swanson Charles G and Swanson Alma J
Current Estimated Value
Home Financials for this Owner
Home Financials are based on the most recent Mortgage that was taken out on this home.
Original Mortgage
$222,627
Outstanding Balance
$157,940
Interest Rate
3.43%
Mortgage Type
New Conventional
Estimated Equity
$430,662
Purchase Details
Closed on
Feb 12, 2013
Sold by
Swanson Charles G and Swanson Alma J
Bought by
Realstar Limited Llc
Purchase Details
Closed on
May 25, 2012
Sold by
Hilton Head Lakes North Residential Deve
Bought by
Swanson Charles G and Swanson Alma J
Home Financials for this Owner
Home Financials are based on the most recent Mortgage that was taken out on this home.
Original Mortgage
$49,491
Interest Rate
3.9%
Mortgage Type
Seller Take Back
Create a Home Valuation Report for This Property
The Home Valuation Report is an in-depth analysis detailing your home's value as well as a comparison with similar homes in the area
Home Values in the Area
Average Home Value in this Area
Purchase History
| Date | Buyer | Sale Price | Title Company |
|---|---|---|---|
| Swanson Charles G | $296,837 | -- | |
| Realstar Limited Llc | $54,990 | -- | |
| Swanson Charles G | $54,990 | -- |
Source: Public Records
Mortgage History
| Date | Status | Borrower | Loan Amount |
|---|---|---|---|
| Open | Swanson Charles G | $222,627 | |
| Previous Owner | Swanson Charles G | $49,491 |
Source: Public Records
Tax History Compared to Growth
Tax History
| Year | Tax Paid | Tax Assessment Tax Assessment Total Assessment is a certain percentage of the fair market value that is determined by local assessors to be the total taxable value of land and additions on the property. | Land | Improvement |
|---|---|---|---|---|
| 2024 | $3,005 | $14,900 | $2,760 | $12,140 |
| 2023 | $2,806 | $14,900 | $0 | $0 |
| 2022 | $3,071 | $14,900 | $2,760 | $12,140 |
| 2021 | $2,854 | $12,960 | $2,400 | $10,560 |
| 2020 | $2,814 | $12,960 | $2,400 | $10,560 |
| 2019 | $2,799 | $12,960 | $2,400 | $10,560 |
| 2018 | $2,717 | $12,960 | $2,400 | $10,560 |
| 2017 | $2,711 | $12,960 | $2,400 | $10,560 |
| 2016 | $2,767 | $12,960 | $2,400 | $10,560 |
| 2015 | $2,506 | $11,870 | $2,200 | $9,670 |
| 2014 | $2,591 | $11,870 | $2,200 | $9,670 |
Source: Public Records
Map
Nearby Homes
- 1466 Wiregrass Way
- 398 Givhans Loop
- 366 Givhans Loop
- 383 Bluestem Ln
- 1273 Club Way
- 1651 Club Way
- 61 River Oak Way
- 112 Hawthorn Ln
- 64 Hawthorn Ln
- 250 Hawthorn Ln
- 742 Wiregrass Way
- 210 Redbud Ln
- 165 Redbud Ln
- 57 Bluestem Ln
- 223 Redbud Ln
- 564 River Oak Way
- 152 Clearwater Walk
- 86 Garden Mist Ln
- 288 Garden Gate Cir W
- 257 Garden Gate Cir E
- 1688 Wiregrass Way
- 1750 Wiregrass Way
- 1656 Wiregrass Way
- 1788 Wiregrass Way
- 1671 Wiregrass Way
- 1781 Wiregrass Way
- 1616 Wiregrass Way
- 1826 Wiregrass Way
- 1637 Wiregrass Way
- 1821 Wiregrass Way
- 1866 Wiregrass Way
- 1859 Wiregrass Way
- 1542 Wiregrass Way
- 1906 Wiregrass Way
- 1500 Wiregrass Way
- 1545 Wiregrass Way
- 1521 Wiregrass Way
- 1941 Wiregrass Way
- 1948 Wiregrass Way
- 1440 Wiregrass Way