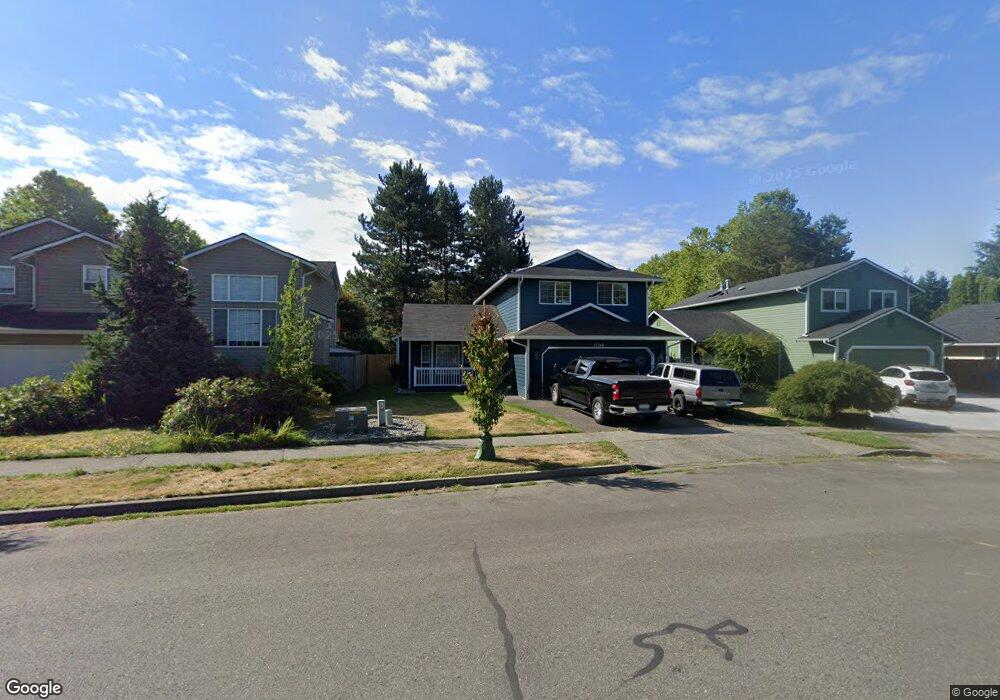
17246 153rd St SE Monroe, WA 98272
Estimated Value: $609,000 - $652,000
3
Beds
3
Baths
1,566
Sq Ft
$400/Sq Ft
Est. Value
About This Home
This home is located at 17246 153rd St SE, Monroe, WA 98272 and is currently estimated at $626,856, approximately $400 per square foot. 17246 153rd St SE is a home located in Snohomish County with nearby schools including Fryelands Elementary School, Monroe High School, and Monroe Christian School.
Ownership History
Date
Name
Owned For
Owner Type
Purchase Details
Closed on
Mar 3, 2006
Sold by
Fellows Robert L and Fellows Beth J
Bought by
Fontier John and Filler Paula
Current Estimated Value
Home Financials for this Owner
Home Financials are based on the most recent Mortgage that was taken out on this home.
Original Mortgage
$228,000
Outstanding Balance
$127,864
Interest Rate
6.04%
Mortgage Type
Fannie Mae Freddie Mac
Estimated Equity
$498,992
Purchase Details
Closed on
Aug 12, 1996
Sold by
Bright Charles W and Bright Patricia L
Bought by
Fellows Robert L and Fellows Beth J
Home Financials for this Owner
Home Financials are based on the most recent Mortgage that was taken out on this home.
Original Mortgage
$134,950
Interest Rate
8.42%
Purchase Details
Closed on
Apr 3, 1996
Sold by
Welcome Robert R and Welcome May Marie
Bought by
Bright Charles W and Bright Patricia
Create a Home Valuation Report for This Property
The Home Valuation Report is an in-depth analysis detailing your home's value as well as a comparison with similar homes in the area
Home Values in the Area
Average Home Value in this Area
Purchase History
| Date | Buyer | Sale Price | Title Company |
|---|---|---|---|
| Fontier John | $285,280 | Stewart Title Of Snohomish C | |
| Fellows Robert L | $144,950 | -- | |
| Bright Charles W | $86,000 | -- |
Source: Public Records
Mortgage History
| Date | Status | Borrower | Loan Amount |
|---|---|---|---|
| Open | Fontier John | $228,000 | |
| Closed | Fontier John | $57,000 | |
| Previous Owner | Fellows Robert L | $134,950 |
Source: Public Records
Tax History Compared to Growth
Tax History
| Year | Tax Paid | Tax Assessment Tax Assessment Total Assessment is a certain percentage of the fair market value that is determined by local assessors to be the total taxable value of land and additions on the property. | Land | Improvement |
|---|---|---|---|---|
| 2025 | $4,053 | $523,100 | $304,000 | $219,100 |
| 2024 | $4,053 | $500,500 | $289,000 | $211,500 |
| 2023 | $4,166 | $558,100 | $319,000 | $239,100 |
| 2022 | $3,774 | $403,400 | $213,000 | $190,400 |
| 2020 | $3,385 | $348,600 | $188,000 | $160,600 |
| 2019 | $3,242 | $329,600 | $178,000 | $151,600 |
| 2018 | $3,478 | $289,800 | $148,000 | $141,800 |
| 2017 | $2,942 | $256,500 | $125,000 | $131,500 |
| 2016 | $2,823 | $226,500 | $103,000 | $123,500 |
| 2015 | $2,871 | $216,700 | $89,000 | $127,700 |
| 2013 | $2,412 | $166,500 | $73,000 | $93,500 |
Source: Public Records
Map
Nearby Homes
- 15217 172nd Ave SE
- 15087 172nd Ave SE
- 17284 157th St SE
- 16855 Wales St SE
- 17342 Mountain View Rd SE
- 17856 152nd St SE
- 15111 167th Ave SE
- 17795 149th St SE Unit 9
- 17815 149th St SE Unit 14
- 15027 179th Ave SE
- 17803 149th St SE Unit 11
- 16625 Ladd St SE
- 23311 165th Ave SE
- 16951 Tulip Ln
- 15648 Lakeview Ave SE
- 18155 W Columbia St
- 17417 W Main St Unit E101
- 16096 Roma Dr SE
- 15121 182nd Ave SE
- 15327 182nd Ave SE
- 17254 153rd St SE
- 17234 153rd St SE
- 17222 153rd St SE
- 17266 153rd St SE
- 15228 Austin Ave SE
- 17249 153rd St SE
- 17257 153rd St SE
- 17278 153rd St SE
- 15255 172nd Ave SE
- 17269 153rd St SE
- 15330 173rd Ave SE
- 17290 153rd St SE
- 15206 Austin Ave SE
- 17275 153rd St SE
- 15187 Austin Ave SE
- 15267 172nd Ave SE
- 15342 173rd Ave SE
- 15266 172nd Ave SE
- 17287 153rd St SE
- 15354 173rd Ave SE