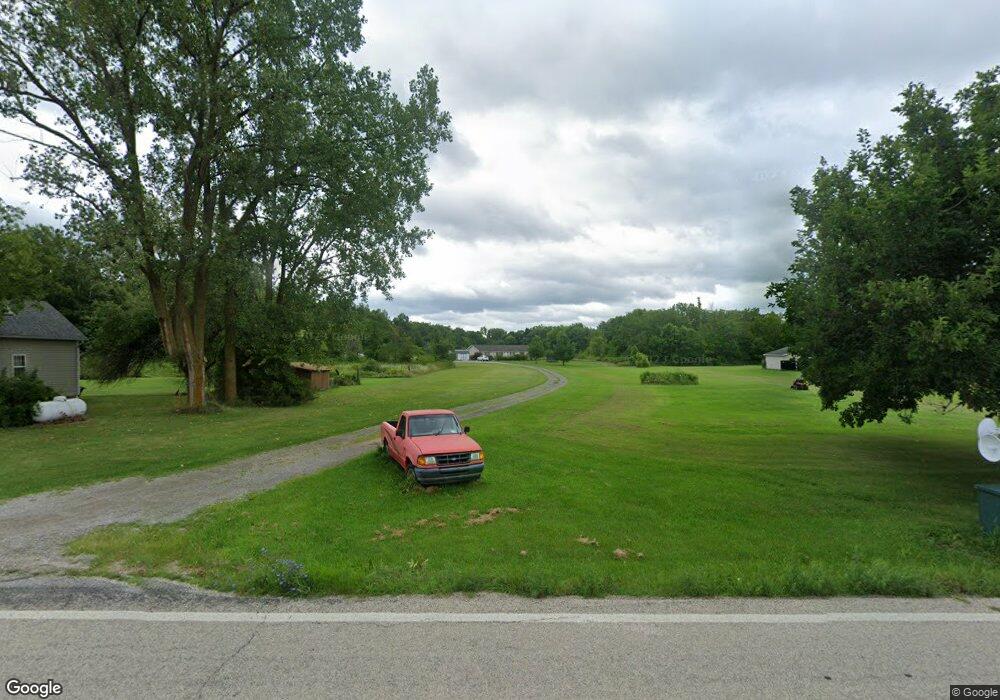
17247 State Route 739 Richwood, OH 43344
Estimated Value: $260,000 - $461,744
3
Beds
2
Baths
2,280
Sq Ft
$168/Sq Ft
Est. Value
About This Home
This home is located at 17247 State Route 739, Richwood, OH 43344 and is currently estimated at $382,436, approximately $167 per square foot. 17247 State Route 739 is a home located in Union County with nearby schools including North Union Elementary School, North Union Middle School, and North Union High School.
Ownership History
Date
Name
Owned For
Owner Type
Purchase Details
Closed on
Apr 6, 2010
Sold by
Nationstar Mortgage Llc
Bought by
Arnold Joel K
Current Estimated Value
Home Financials for this Owner
Home Financials are based on the most recent Mortgage that was taken out on this home.
Original Mortgage
$96,697
Interest Rate
5.13%
Mortgage Type
FHA
Purchase Details
Closed on
Jun 25, 2009
Sold by
Penix Shane and Penix Patricia
Bought by
Nationstar Mortgage Llc
Purchase Details
Closed on
Jan 30, 2003
Sold by
Temple Reva R
Bought by
Penix Shane and Penix Patricia A
Home Financials for this Owner
Home Financials are based on the most recent Mortgage that was taken out on this home.
Original Mortgage
$118,400
Interest Rate
6.13%
Create a Home Valuation Report for This Property
The Home Valuation Report is an in-depth analysis detailing your home's value as well as a comparison with similar homes in the area
Home Values in the Area
Average Home Value in this Area
Purchase History
| Date | Buyer | Sale Price | Title Company |
|---|---|---|---|
| Arnold Joel K | $98,000 | Resource Title Agency Inc | |
| Nationstar Mortgage Llc | -- | Sovereign Title Agency Llc | |
| Penix Shane | $18,900 | -- | |
| Britenstine Amos Brock | $15,000 | -- |
Source: Public Records
Mortgage History
| Date | Status | Borrower | Loan Amount |
|---|---|---|---|
| Previous Owner | Arnold Joel K | $96,697 | |
| Previous Owner | Penix Shane | $118,400 |
Source: Public Records
Tax History Compared to Growth
Tax History
| Year | Tax Paid | Tax Assessment Tax Assessment Total Assessment is a certain percentage of the fair market value that is determined by local assessors to be the total taxable value of land and additions on the property. | Land | Improvement |
|---|---|---|---|---|
| 2024 | $5,440 | $129,850 | $17,490 | $112,360 |
| 2023 | $5,440 | $129,850 | $17,490 | $112,360 |
| 2022 | $5,355 | $129,850 | $17,490 | $112,360 |
| 2021 | $4,130 | $91,770 | $13,450 | $78,320 |
| 2020 | $4,187 | $91,770 | $13,450 | $78,320 |
| 2019 | $4,152 | $91,770 | $13,450 | $78,320 |
| 2018 | $3,960 | $85,280 | $11,640 | $73,640 |
| 2017 | $3,618 | $85,280 | $11,640 | $73,640 |
| 2016 | $3,708 | $85,280 | $11,640 | $73,640 |
| 2015 | $3,250 | $72,270 | $11,640 | $60,630 |
| 2014 | $3,280 | $72,270 | $11,640 | $60,630 |
| 2013 | $3,329 | $72,270 | $11,640 | $60,630 |
Source: Public Records
Map
Nearby Homes
- 32675 Winnemac Rd
- 0 Winnemac Rd Unit Tract 5 225033739
- 0 Winnemac Rd Unit Tract 4 225033731
- 0 Winnemac Rd Unit Tract 3 225033725
- 0 Winnemac Rd Unit Tract 1 225033712
- 33883 Winnemac Rd
- 34780 Shertzer Rd
- 18120 Yoakum Rd
- 15275 Boundary Rd
- 9900 Windfall Rd
- 18055 Miller Rd
- 31434 State Route 31
- 31535 State Route 31
- 0 Ohio 31
- 32220 State Route 31
- 30650 State Route 739
- 22273 County Road 240
- 25875 Ohio 31
- 29900 Le Masters Rd
- 0 Richwood Miller Rd Unit 225033397
- 17247 Ohio 739
- 17265 Ohio 739
- 17243 State Route 739
- 17181 State Route 739
- 0 State Route 739
- 17399 State Route 739
- 17250 State Route 739
- 17077 State Route 739
- 33021 Fields Rd
- 17200 State Route 739
- 32899 Fields Rd
- 17176 State Route 739
- 17469 Ohio 739
- 17469 State Route 739
- 17400 State Route 739
- 33033 Fields Rd
- 32815 Fields Rd
- 32875 Fields Rd
- 33093 Fields Rd
- 32949 Fields Rd