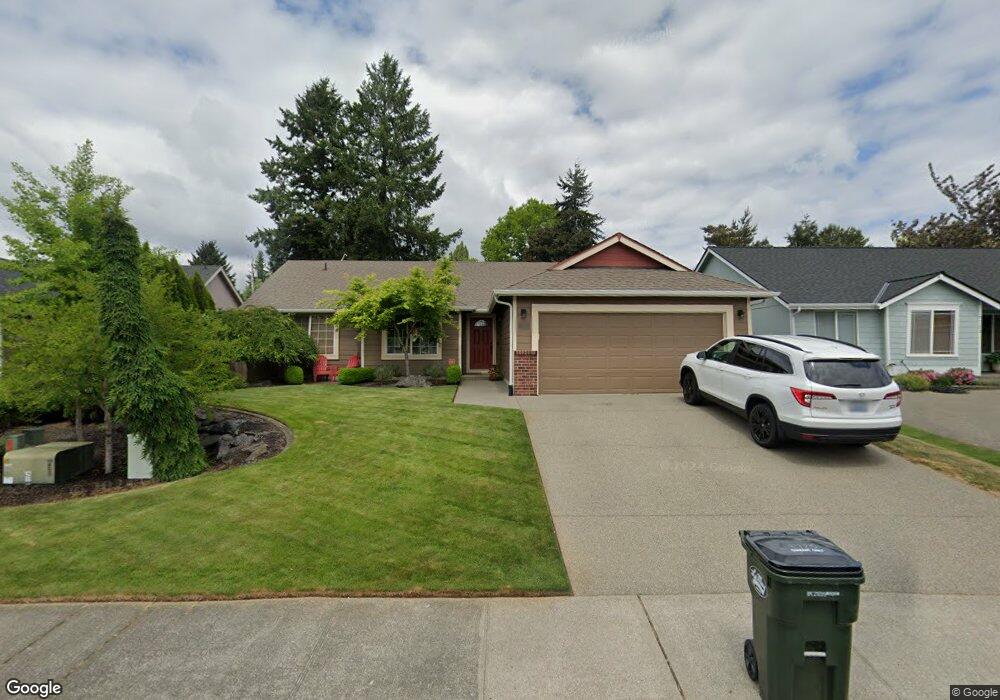
1725 53rd Loop SE Olympia, WA 98501
Deschutes NeighborhoodEstimated Value: $531,000 - $588,000
3
Beds
2
Baths
1,673
Sq Ft
$329/Sq Ft
Est. Value
About This Home
This home is located at 1725 53rd Loop SE, Olympia, WA 98501 and is currently estimated at $549,890, approximately $328 per square foot. 1725 53rd Loop SE is a home located in Thurston County with nearby schools including Centennial Elementary School, Washington Middle School, and Olympia High School.
Ownership History
Date
Name
Owned For
Owner Type
Purchase Details
Closed on
Jan 15, 2004
Sold by
Lucero Jason D and Lucero Nicole A
Bought by
Filmore Kevin and Filmore Andrea
Current Estimated Value
Home Financials for this Owner
Home Financials are based on the most recent Mortgage that was taken out on this home.
Original Mortgage
$190,840
Outstanding Balance
$89,991
Interest Rate
6.02%
Mortgage Type
Unknown
Estimated Equity
$459,899
Purchase Details
Closed on
Aug 30, 2001
Sold by
Zvirzdys Edward B and Zvirzdys Lisa S
Bought by
Lucero Jason D and Lucero Nicole A
Home Financials for this Owner
Home Financials are based on the most recent Mortgage that was taken out on this home.
Original Mortgage
$173,349
Interest Rate
7.09%
Mortgage Type
VA
Purchase Details
Closed on
Aug 24, 2000
Sold by
Village Homes Inc
Bought by
Zvirzdys Edward B and Zvirzdys Lisa S
Home Financials for this Owner
Home Financials are based on the most recent Mortgage that was taken out on this home.
Original Mortgage
$134,350
Interest Rate
8.2%
Create a Home Valuation Report for This Property
The Home Valuation Report is an in-depth analysis detailing your home's value as well as a comparison with similar homes in the area
Home Values in the Area
Average Home Value in this Area
Purchase History
| Date | Buyer | Sale Price | Title Company |
|---|---|---|---|
| Filmore Kevin | $193,000 | Thurston County Title | |
| Lucero Jason D | $169,950 | Chicago Title Insurance Comp | |
| Zvirzdys Edward B | $42,500 | Chicago Title Insurance Co |
Source: Public Records
Mortgage History
| Date | Status | Borrower | Loan Amount |
|---|---|---|---|
| Open | Filmore Kevin | $190,840 | |
| Previous Owner | Lucero Jason D | $173,349 | |
| Previous Owner | Zvirzdys Edward B | $134,350 |
Source: Public Records
Tax History Compared to Growth
Tax History
| Year | Tax Paid | Tax Assessment Tax Assessment Total Assessment is a certain percentage of the fair market value that is determined by local assessors to be the total taxable value of land and additions on the property. | Land | Improvement |
|---|---|---|---|---|
| 2024 | $4,741 | $505,600 | $168,700 | $336,900 |
| 2023 | $4,741 | $467,400 | $156,300 | $311,100 |
| 2022 | $4,357 | $460,800 | $122,500 | $338,300 |
| 2021 | $3,938 | $371,600 | $98,100 | $273,500 |
| 2020 | $4,014 | $309,600 | $77,300 | $232,300 |
| 2019 | $3,548 | $307,000 | $94,700 | $212,300 |
| 2018 | $3,793 | $290,300 | $68,900 | $221,400 |
| 2017 | $3,581 | $286,700 | $72,700 | $214,000 |
| 2016 | $3,420 | $256,950 | $70,350 | $186,600 |
| 2014 | -- | $261,250 | $71,450 | $189,800 |
Source: Public Records
Map
Nearby Homes
- 5113 Brassfield Dr SE
- 4509 Briggs Dr SE
- 2433 55th Ave SE
- 802 Silo Ct SE
- 4700 Delta Ln SE
- 2427 Boulevard Heights Loop SE
- 4708 Delta Ln SE
- 1533 Vineyard Ave SE
- 4901 Delta Ln SE
- 2638 58th Ct SE
- 4711 Cleveland Ave SE
- 753 T St SE
- 0 Hansen St SE
- 4932 Siskiyou Loop SE
- 1156 68th Loop SE Unit 43
- 1111 68th (Lot 13) Loop SE
- 2825 Haig Dr SE
- The Cristina Plan at Three Lakes Crossing
- The Alpine Plan at Three Lakes Crossing
- The Brighton Plan at Three Lakes Crossing
- 1723 53rd Loop SE
- 1727 53rd Loop SE
- 1731 53rd Loop SE
- 1719 53rd Loop SE
- 1724 53rd Loop SE
- 1728 53rd Loop SE
- 1733 53rd Loop SE
- 1722 53rd Loop SE
- 5237 Arlington Ct SE
- 1718 53rd Ave SE
- 1738 53rd Loop SE
- 1710 53rd Ave SE
- 1720 53rd Loop SE
- 1760 53rd Loop SE
- 1735 53rd Loop SE
- 5223 Arlington Ct SE
- 1740 53rd Loop SE
- 1737 53rd Loop SE
- 1861 53rd Loop SE