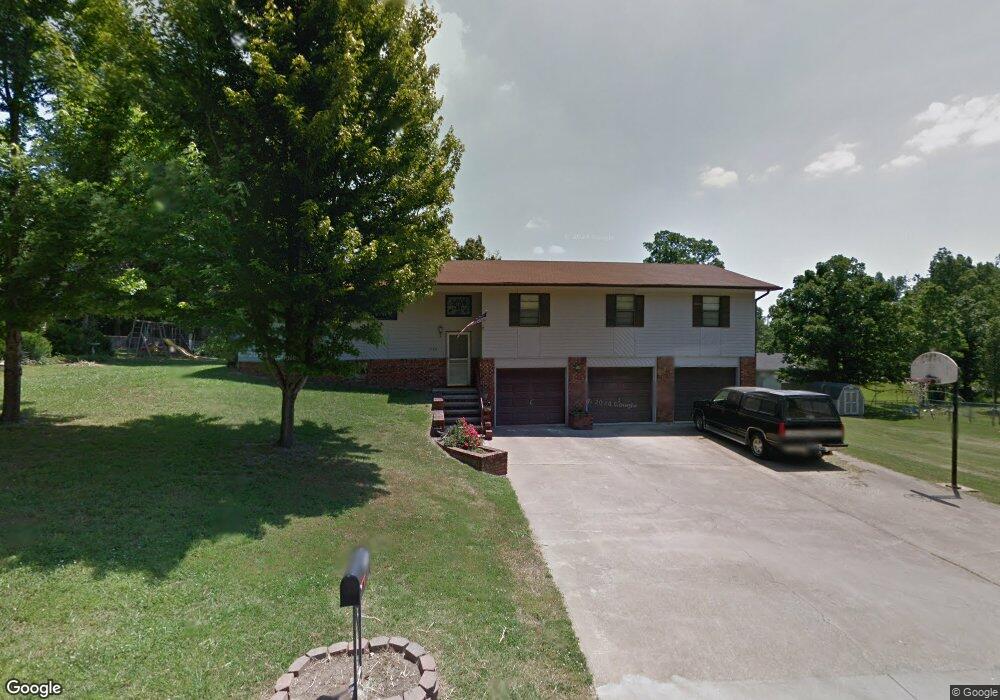
1725 Bamby St Neosho, MO 64850
Estimated Value: $231,000 - $278,194
4
Beds
--
Bath
1,926
Sq Ft
$130/Sq Ft
Est. Value
About This Home
This home is located at 1725 Bamby St, Neosho, MO 64850 and is currently estimated at $250,299, approximately $129 per square foot. 1725 Bamby St is a home with nearby schools including Neosho High School, Ozark Christian Academy, and Neosho Christian Schools.
Ownership History
Date
Name
Owned For
Owner Type
Purchase Details
Closed on
Jun 16, 2021
Sold by
Wilson Richard T and Wilson Randall E
Bought by
Wilson Rodney Alan and Wilson Lindsay Dawn
Current Estimated Value
Home Financials for this Owner
Home Financials are based on the most recent Mortgage that was taken out on this home.
Original Mortgage
$120,000
Outstanding Balance
$108,645
Interest Rate
2.9%
Mortgage Type
New Conventional
Estimated Equity
$141,654
Purchase Details
Closed on
Dec 30, 2020
Sold by
Ruth Ann Wilson Living Trust
Bought by
Wilson Richard T and Wilson Randall E
Create a Home Valuation Report for This Property
The Home Valuation Report is an in-depth analysis detailing your home's value as well as a comparison with similar homes in the area
Home Values in the Area
Average Home Value in this Area
Purchase History
| Date | Buyer | Sale Price | Title Company |
|---|---|---|---|
| Wilson Rodney Alan | $159,600 | None Listed On Document | |
| Wilson Richard T | -- | None Listed On Document |
Source: Public Records
Mortgage History
| Date | Status | Borrower | Loan Amount |
|---|---|---|---|
| Open | Wilson Rodney Alan | $120,000 |
Source: Public Records
Tax History Compared to Growth
Tax History
| Year | Tax Paid | Tax Assessment Tax Assessment Total Assessment is a certain percentage of the fair market value that is determined by local assessors to be the total taxable value of land and additions on the property. | Land | Improvement |
|---|---|---|---|---|
| 2024 | $1,255 | $22,690 | -- | -- |
| 2023 | $1,255 | $22,690 | $2,870 | $19,820 |
| 2022 | $1,255 | $22,190 | -- | -- |
| 2021 | $1,224 | $22,190 | $0 | $0 |
| 2020 | $1,121 | $20,440 | $0 | $0 |
| 2019 | $1,024 | $20,440 | $0 | $0 |
| 2018 | $1,034 | $20,440 | $0 | $0 |
| 2017 | $1,015 | $20,440 | $0 | $0 |
| 2016 | $1,015 | $20,140 | $0 | $0 |
| 2015 | -- | $20,670 | $0 | $0 |
| 2014 | -- | $20,670 | $0 | $0 |
Source: Public Records
Map
Nearby Homes