Estimated Value: $522,940 - $702,000
--
Bed
2
Baths
3,096
Sq Ft
$194/Sq Ft
Est. Value
About This Home
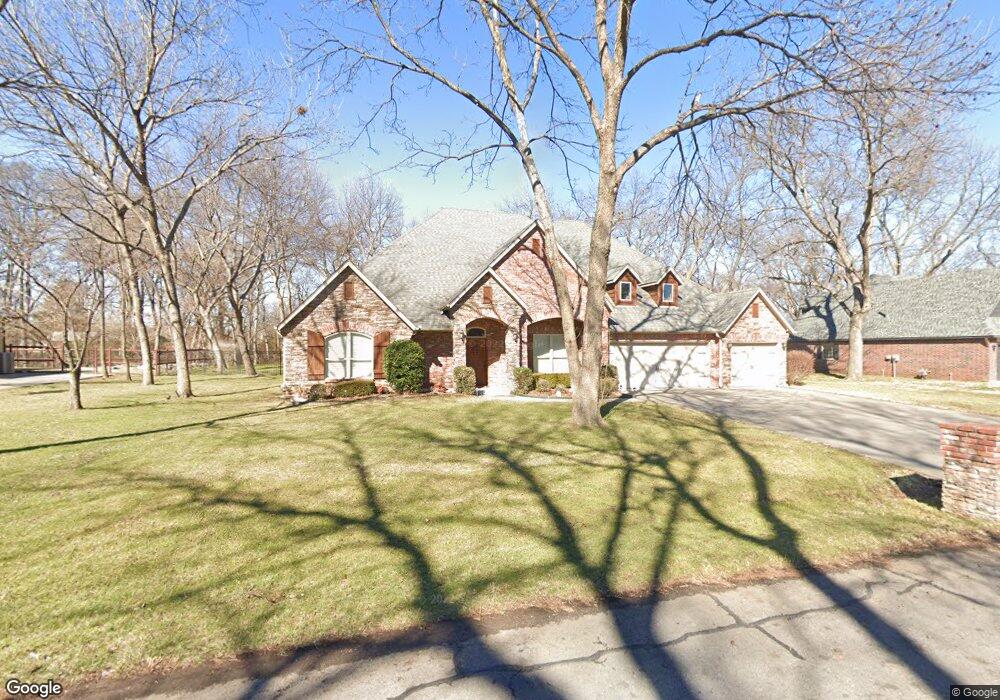
This home is located at 1725 E 136th Place S, Bixby, OK 74008 and is currently estimated at $601,735, approximately $194 per square foot. 1725 E 136th Place S is a home located in Tulsa County with nearby schools including Central Elementary School, Bixby Central Intermediate School, and Bixby Middle School.
Ownership History
Date
Name
Owned For
Owner Type
Purchase Details
Closed on
Apr 11, 2008
Sold by
Goldstar Development Inc
Bought by
Smith Timothy J and Smith Tammie J
Current Estimated Value
Purchase Details
Closed on
Jan 25, 2007
Sold by
Hudson Thomas B and Hudson Gloria F
Bought by
Goldstar Development Inc
Home Financials for this Owner
Home Financials are based on the most recent Mortgage that was taken out on this home.
Original Mortgage
$54,605
Interest Rate
6.11%
Mortgage Type
Purchase Money Mortgage
Purchase Details
Closed on
Apr 12, 2004
Sold by
Pecan Creek Development Llc
Bought by
Hudson Thomas B and Hudson Gloria F
Create a Home Valuation Report for This Property
The Home Valuation Report is an in-depth analysis detailing your home's value as well as a comparison with similar homes in the area
Home Values in the Area
Average Home Value in this Area
Purchase History
| Date | Buyer | Sale Price | Title Company |
|---|---|---|---|
| Smith Timothy J | $352,000 | Multiple | |
| Goldstar Development Inc | $53,000 | None Available | |
| Hudson Thomas B | $38,000 | First American Title & Abstr |
Source: Public Records
Mortgage History
| Date | Status | Borrower | Loan Amount |
|---|---|---|---|
| Previous Owner | Goldstar Development Inc | $54,605 |
Source: Public Records
Tax History Compared to Growth
Tax History
| Year | Tax Paid | Tax Assessment Tax Assessment Total Assessment is a certain percentage of the fair market value that is determined by local assessors to be the total taxable value of land and additions on the property. | Land | Improvement |
|---|---|---|---|---|
| 2025 | $5,604 | $45,605 | $4,492 | $41,113 |
| 2024 | $5,476 | $44,247 | $4,680 | $39,567 |
| 2023 | $5,476 | $43,930 | $5,540 | $38,390 |
| 2022 | $5,411 | $41,651 | $5,667 | $35,984 |
| 2021 | $5,415 | $41,651 | $5,667 | $35,984 |
| 2020 | $5,170 | $40,431 | $5,663 | $34,768 |
| 2019 | $5,216 | $40,431 | $5,663 | $34,768 |
| 2018 | $5,235 | $40,431 | $5,663 | $34,768 |
| 2017 | $5,233 | $41,431 | $5,803 | $35,628 |
| 2016 | $5,258 | $41,078 | $5,753 | $35,325 |
| 2015 | $4,893 | $41,431 | $5,803 | $35,628 |
| 2014 | $4,803 | $38,720 | $5,423 | $33,297 |
Source: Public Records
Map
Nearby Homes
- 1716 E 136th Place S
- 13706 S 18th St
- 2717 E 134th St S
- 2718 E 134th St S
- 1664 E 138th St
- 2613 E 134th St S
- 2722 E 134th St S
- 2614 E 134th St S
- 13825 S Lewis Ave
- 13533 S Lewis Ave
- 1946 E 135th St S
- 13507 S 20th St
- 13409 S 20th St
- 2326 E 134th St S
- 13408 S 20th Ct
- 13634 S 20th Place E
- 2070 E 136th St S
- 13401 S 20th Ct
- 13722 S 20th Place E
- 2078 E 136th Place S
- 1729 E 136th Place S
- 1728 E 136th Place S
- 1803 E 136th Place S
- 1724 E 136th Place S
- 1732 E 136th Place S
- 13117 S 18th St
- 13101 S 18th St
- 1717 E 136th Place S
- 2820 E 134th St S
- 2892 E 134th St S
- 1727 E 137th St S
- 13605 S 18th St
- 1723 E 137th St S
- 13611 S 18th St
- 1807 E 136th Place S
- 1719 E 137th St S
- 13623 S 18th St
- 13618 S 18th Place
- 13606 S 18th Place
- 13628 S 18th Place