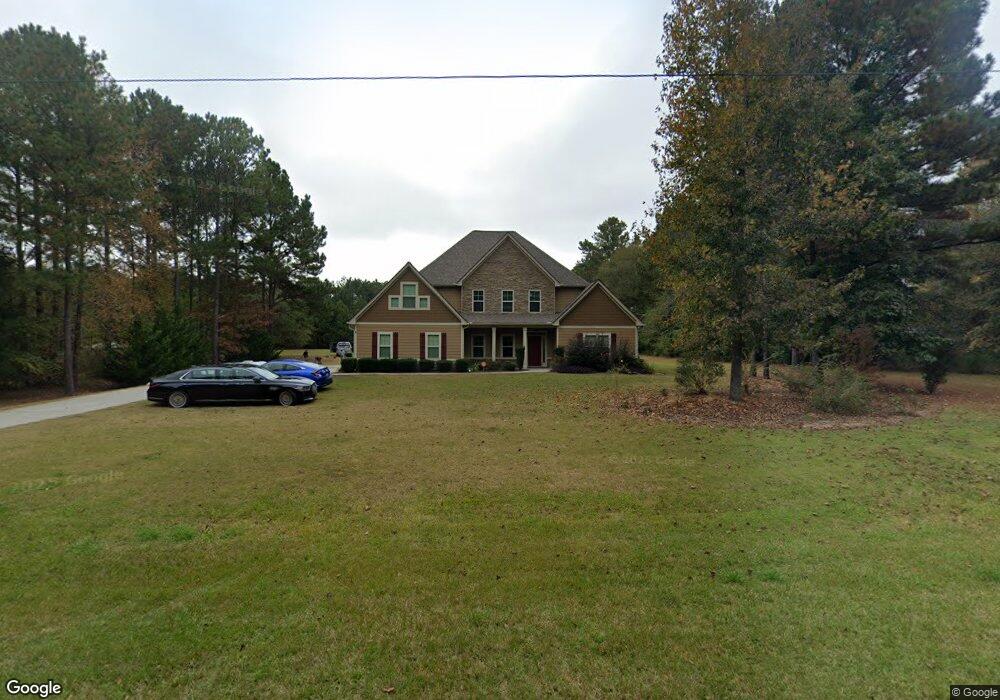
1725 Hines Rd Lagrange, GA 30241
Estimated Value: $494,000 - $532,150
4
Beds
4
Baths
3,429
Sq Ft
$149/Sq Ft
Est. Value
About This Home
This home is located at 1725 Hines Rd, Lagrange, GA 30241 and is currently estimated at $509,788, approximately $148 per square foot. 1725 Hines Rd is a home located in Troup County with nearby schools including Hogansville Elementary School, Callaway Elementary School, and Callaway Middle School.
Ownership History
Date
Name
Owned For
Owner Type
Purchase Details
Closed on
Jun 30, 2021
Sold by
Troxell Bobby G
Bought by
Berkebile Rosemarie and Berkebile Frederick
Current Estimated Value
Home Financials for this Owner
Home Financials are based on the most recent Mortgage that was taken out on this home.
Original Mortgage
$284,000
Outstanding Balance
$257,686
Interest Rate
2.9%
Mortgage Type
VA
Estimated Equity
$252,102
Purchase Details
Closed on
Feb 28, 2013
Sold by
Jeff Lindsey Communities I
Bought by
Troxell Bobby G and Troxell Deborah
Home Financials for this Owner
Home Financials are based on the most recent Mortgage that was taken out on this home.
Original Mortgage
$230,497
Interest Rate
3.56%
Mortgage Type
FHA
Purchase Details
Closed on
Sep 30, 1988
Sold by
Hobbs Grover Allen Sr(Right Of
Bought by
Grover Allen Hobbs
Purchase Details
Closed on
Aug 18, 1978
Sold by
Southern Forrestinc
Bought by
Hobbs Grover Allen Sr(Right Of
Create a Home Valuation Report for This Property
The Home Valuation Report is an in-depth analysis detailing your home's value as well as a comparison with similar homes in the area
Home Values in the Area
Average Home Value in this Area
Purchase History
| Date | Buyer | Sale Price | Title Company |
|---|---|---|---|
| Berkebile Rosemarie | $355,000 | -- | |
| Troxell Bobby G | $234,750 | -- | |
| Grover Allen Hobbs | -- | -- | |
| Hobbs Grover Allen Sr(Right Of | $15,600 | -- |
Source: Public Records
Mortgage History
| Date | Status | Borrower | Loan Amount |
|---|---|---|---|
| Open | Berkebile Rosemarie | $284,000 | |
| Previous Owner | Troxell Bobby G | $230,497 |
Source: Public Records
Tax History Compared to Growth
Tax History
| Year | Tax Paid | Tax Assessment Tax Assessment Total Assessment is a certain percentage of the fair market value that is determined by local assessors to be the total taxable value of land and additions on the property. | Land | Improvement |
|---|---|---|---|---|
| 2024 | $4,767 | $184,720 | $10,000 | $174,720 |
| 2023 | $4,767 | $184,720 | $10,000 | $174,720 |
| 2022 | $3,560 | $137,480 | $10,000 | $127,480 |
| 2021 | $3,108 | $105,040 | $10,000 | $95,040 |
| 2020 | $3,048 | $103,040 | $8,000 | $95,040 |
| 2019 | $2,927 | $99,040 | $8,000 | $91,040 |
| 2018 | $2,927 | $99,040 | $8,000 | $91,040 |
| 2017 | $2,927 | $99,040 | $8,000 | $91,040 |
| 2016 | $2,927 | $99,044 | $8,000 | $91,044 |
| 2015 | $2,932 | $99,044 | $8,000 | $91,044 |
| 2014 | $2,478 | $83,870 | $8,000 | $75,870 |
| 2013 | -- | $42,020 | $7,486 | $34,534 |
Source: Public Records
Map
Nearby Homes
- 1701 Hines Rd
- 592 Mountville Hogansville Rd
- 0 Alverson Rd
- 1104 Alverson Rd
- 0 Fincher St
- 4117 Greenville Rd
- 142 Carr Rd
- 4973 Greenville Rd
- Cypress Plan at Antler Ridge
- 49 Lagrange Hwy
- 229 Big Springs Mountville Rd
- 547 Hines Rd
- 494 Thrash Rd
- 1259 Perkins Rd
- 286 Hines Rd
- 132 Hines Rd
- 453 E Mount Zion Church Rd
- 425 Mount Zion Church Rd
- 829 Thrash Rd
- 0 Hines Rd Unit 10488606
- 1723 Hines Rd
- 1719 Hines Rd
- 203 Alverson Rd
- 1717 Hines Rd
- 1721 Hines Rd
- 115 Alverson Rd
- 110 Renae Ln Unit LOT 13
- 106 Renae Ln Unit LOT 11
- 106 Renae Ln
- 1715 Hines Rd
- 109 Alverson Rd
- 964 Mountville Hogansville Rd
- 104 Renae Ln
- 1713 Hines Rd
- 932 Mountville Hogansville Rd
- 1036 Mountville Hogansville Rd
- 1036 Mountville Hogansville Rd
- 111 Renae Ln
- 102 Renae Ln
- 109 Renae Ln Unit LOT 15