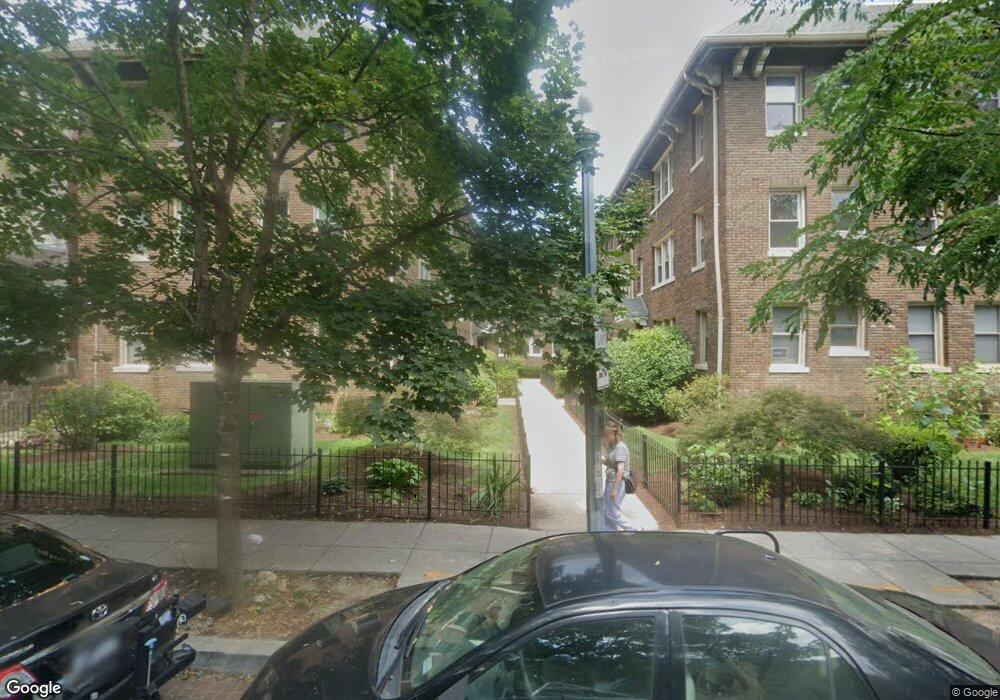
1725 Lanier Place NW Unit 38D Washington, DC 20009
Adams Morgan NeighborhoodEstimated Value: $344,811 - $367,000
1
Bed
1
Bath
515
Sq Ft
$694/Sq Ft
Est. Value
About This Home
This home is located at 1725 Lanier Place NW Unit 38D, Washington, DC 20009 and is currently estimated at $357,453, approximately $694 per square foot. 1725 Lanier Place NW Unit 38D is a home located in District of Columbia with nearby schools including H.D. Cooke Elementary School, Columbia Heights Education Campus, and Cardozo Education Campus.
Ownership History
Date
Name
Owned For
Owner Type
Purchase Details
Closed on
Jun 22, 2015
Sold by
Robertson Lori A
Bought by
Cardinal Laura J
Current Estimated Value
Home Financials for this Owner
Home Financials are based on the most recent Mortgage that was taken out on this home.
Original Mortgage
$224,000
Outstanding Balance
$173,680
Interest Rate
3.78%
Mortgage Type
New Conventional
Estimated Equity
$183,773
Purchase Details
Closed on
Sep 27, 2002
Sold by
Raymundo Luz
Bought by
Robertson Lori A
Home Financials for this Owner
Home Financials are based on the most recent Mortgage that was taken out on this home.
Original Mortgage
$155,200
Interest Rate
6.03%
Purchase Details
Closed on
Feb 22, 2002
Sold by
In 1725 Lanier Pl Nw Coop
Bought by
Raymundo Milton and Raymundo Luz
Home Financials for this Owner
Home Financials are based on the most recent Mortgage that was taken out on this home.
Original Mortgage
$39,300
Interest Rate
6.88%
Mortgage Type
New Conventional
Create a Home Valuation Report for This Property
The Home Valuation Report is an in-depth analysis detailing your home's value as well as a comparison with similar homes in the area
Home Values in the Area
Average Home Value in this Area
Purchase History
| Date | Buyer | Sale Price | Title Company |
|---|---|---|---|
| Cardinal Laura J | $280,000 | -- | |
| Robertson Lori A | $160,000 | -- | |
| Raymundo Milton | $33,670 | -- |
Source: Public Records
Mortgage History
| Date | Status | Borrower | Loan Amount |
|---|---|---|---|
| Open | Cardinal Laura J | $224,000 | |
| Previous Owner | Robertson Lori A | $155,200 | |
| Previous Owner | Raymundo Milton | $39,300 |
Source: Public Records
Tax History Compared to Growth
Tax History
| Year | Tax Paid | Tax Assessment Tax Assessment Total Assessment is a certain percentage of the fair market value that is determined by local assessors to be the total taxable value of land and additions on the property. | Land | Improvement |
|---|---|---|---|---|
| 2024 | $2,693 | $332,040 | $99,610 | $232,430 |
| 2023 | $2,743 | $337,380 | $101,210 | $236,170 |
| 2022 | $2,737 | $335,770 | $100,730 | $235,040 |
| 2021 | $2,643 | $324,270 | $97,280 | $226,990 |
| 2020 | $2,697 | $317,270 | $95,180 | $222,090 |
| 2019 | $2,613 | $307,440 | $92,230 | $215,210 |
| 2018 | $2,600 | $305,880 | $0 | $0 |
| 2017 | $2,410 | $283,520 | $0 | $0 |
| 2016 | $2,534 | $298,100 | $0 | $0 |
| 2015 | $2,291 | $269,570 | $0 | $0 |
| 2014 | $2,011 | $236,610 | $0 | $0 |
Source: Public Records
Map
Nearby Homes
- 1725 Lanier Place NW Unit 33A
- 1705 Lanier Place NW Unit 204
- 1669 Columbia Rd NW Unit 304
- 1669 Columbia Rd NW Unit 203
- 1669 Columbia Rd NW Unit 215
- 1669 Columbia Rd NW Unit 109
- 1744 Lanier Place NW Unit 1
- 1744 Lanier Place NW Unit 3
- 2853 Ontario Rd NW Unit 316
- 2853 Ontario Rd NW Unit 107
- 2853 Ontario Rd NW Unit 609
- 2853 Ontario Rd NW Unit 210
- 2853 Ontario Rd NW Unit 323
- 1746 Lanier Place NW Unit 3
- 1746 Lanier Place NW Unit 2
- 2550 17th St NW Unit 205
- 1748 Lanier Place NW Unit 2
- 1767 Lanier Place NW Unit 6
- 1801 Clydesdale Place NW Unit 222
- 1801 Clydesdale Place NW Unit 407
- 1725 Lanier Place NW Unit 8D
- 1725 Lanier Place NW Unit 21A
- 1725 Lanier Place NW Unit 39C
- 1725 Lanier Place NW Unit 36D
- 1725 Lanier Place NW Unit 28D
- 1725 Lanier Place NW Unit 3A
- 1725 Lanier Place NW Unit 9C
- 1725 Lanier Place NW Unit 34B
- 1725 Lanier Place NW Unit 31A
- 1725 Lanier Place NW Unit 32B
- 1725 Lanier Place NW Unit 35C
- 1725 Lanier Place NW Unit 29C
- 1725 Lanier Place NW Unit 22B
- 1725 Lanier Place NW Unit 26D
- 1725 Lanier Place NW Unit 37C
- 1725 Lanier Place NW Unit 1A
- 1725 Lanier Place NW Unit 2B
- 1725 Lanier Place NW Unit 5C
- 1725 Lanier Place NW Unit 25C
- 1725 Lanier Place NW Unit 24B