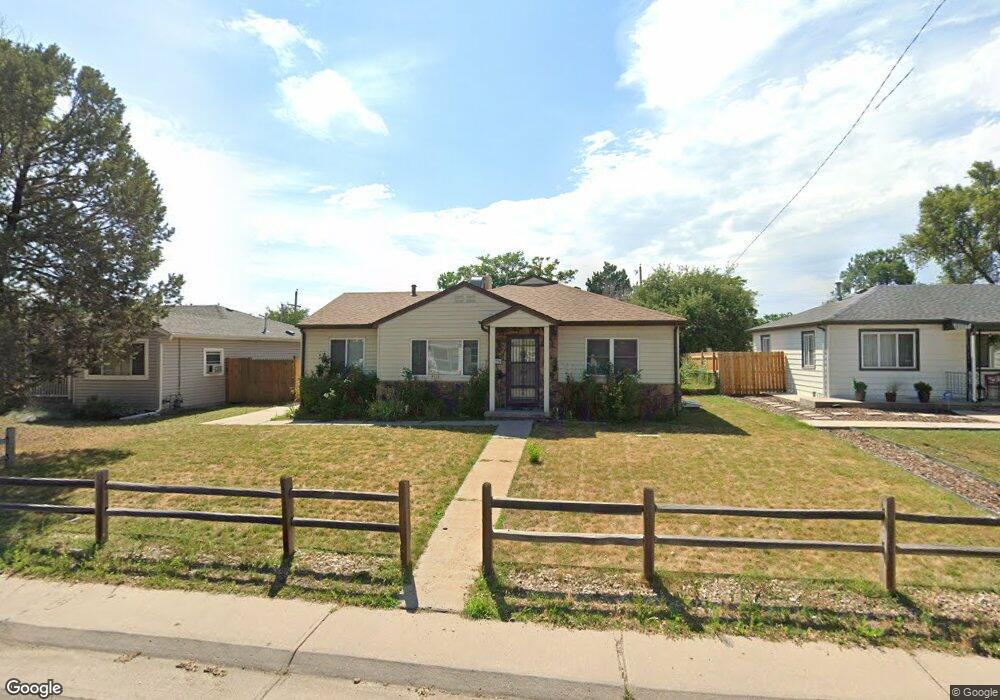
1725 Moline St Aurora, CO 80010
North Aurora NeighborhoodEstimated Value: $383,000 - $441,000
3
Beds
1
Bath
1,300
Sq Ft
$316/Sq Ft
Est. Value
About This Home
This home is located at 1725 Moline St, Aurora, CO 80010 and is currently estimated at $411,419, approximately $316 per square foot. 1725 Moline St is a home located in Adams County with nearby schools including Montview Elementary School, North Middle School Health Sciences & Technology, and Aurora Central High School.
Ownership History
Date
Name
Owned For
Owner Type
Purchase Details
Closed on
Dec 14, 2020
Sold by
Fulton Glenn R and Estate Of Katherine R Fulton
Bought by
Williams Marinna and Neary Mathew
Current Estimated Value
Home Financials for this Owner
Home Financials are based on the most recent Mortgage that was taken out on this home.
Original Mortgage
$337,250
Outstanding Balance
$298,043
Interest Rate
2.8%
Mortgage Type
New Conventional
Estimated Equity
$113,376
Create a Home Valuation Report for This Property
The Home Valuation Report is an in-depth analysis detailing your home's value as well as a comparison with similar homes in the area
Home Values in the Area
Average Home Value in this Area
Purchase History
| Date | Buyer | Sale Price | Title Company |
|---|---|---|---|
| Williams Marinna | $355,000 | None Available |
Source: Public Records
Mortgage History
| Date | Status | Borrower | Loan Amount |
|---|---|---|---|
| Open | Williams Marinna | $337,250 |
Source: Public Records
Tax History
| Year | Tax Paid | Tax Assessment Tax Assessment Total Assessment is a certain percentage of the fair market value that is determined by local assessors to be the total taxable value of land and additions on the property. | Land | Improvement |
|---|---|---|---|---|
| 2025 | $2,575 | $26,790 | $5,440 | $21,350 |
| 2024 | $2,575 | $24,630 | $5,000 | $19,630 |
| 2023 | $2,616 | $28,280 | $5,210 | $23,070 |
| 2022 | $2,267 | $19,950 | $5,350 | $14,600 |
| 2021 | $2,362 | $19,950 | $5,350 | $14,600 |
| 2020 | $1,638 | $21,030 | $5,510 | $15,520 |
| 2019 | $1,635 | $21,030 | $5,510 | $15,520 |
| 2018 | $1,066 | $16,210 | $4,320 | $11,890 |
| 2017 | $947 | $16,210 | $4,320 | $11,890 |
| 2016 | $585 | $11,030 | $2,390 | $8,640 |
| 2015 | $566 | $5,510 | $1,190 | $4,320 |
| 2014 | -- | $4,820 | $1,190 | $3,630 |
Source: Public Records
Map
Nearby Homes
Your Personal Tour Guide
Ask me questions while you tour the home.