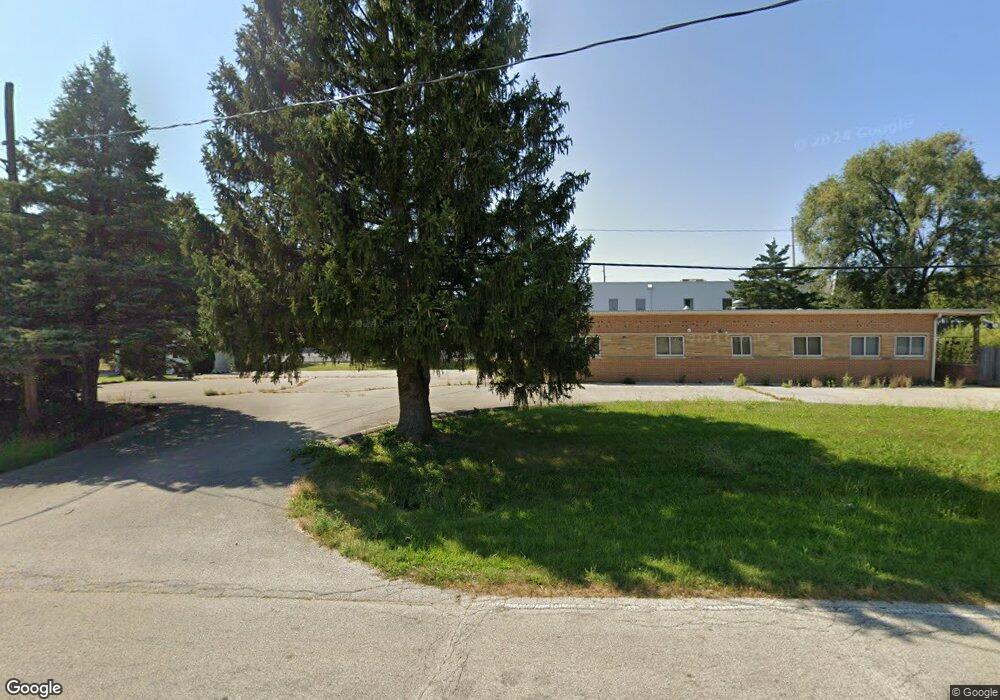
1725 S Fairview Rd Decatur, IL 62521
Enterprise NeighborhoodEstimated Value: $60,220
--
Bed
1
Bath
--
Sq Ft
0.84
Acres
About This Home
This home is located at 1725 S Fairview Rd, Decatur, IL 62521 and is currently estimated at $60,220. 1725 S Fairview Rd is a home located in Macon County with nearby schools including South Shores Elementary School, Stephen Decatur Middle School, and Holy Family Catholic School.
Ownership History
Date
Name
Owned For
Owner Type
Purchase Details
Closed on
Jul 19, 2022
Sold by
Leon Mentzer
Bought by
Williams Justin
Current Estimated Value
Home Financials for this Owner
Home Financials are based on the most recent Mortgage that was taken out on this home.
Original Mortgage
$39,000
Outstanding Balance
$37,149
Interest Rate
5.23%
Mortgage Type
New Conventional
Estimated Equity
$21,365
Purchase Details
Closed on
Jul 18, 2022
Sold by
Groesch and Shelly
Bought by
Quark Llc
Home Financials for this Owner
Home Financials are based on the most recent Mortgage that was taken out on this home.
Original Mortgage
$39,000
Outstanding Balance
$37,149
Interest Rate
5.23%
Mortgage Type
New Conventional
Estimated Equity
$21,365
Purchase Details
Closed on
Jan 15, 2021
Sold by
Stevens Shelly and Groesch Robert
Bought by
Quark Llc
Purchase Details
Closed on
Feb 21, 2018
Sold by
Off The Leash Llc
Bought by
Groesch Robert and Stevens Shelly
Create a Home Valuation Report for This Property
The Home Valuation Report is an in-depth analysis detailing your home's value as well as a comparison with similar homes in the area
Home Values in the Area
Average Home Value in this Area
Purchase History
| Date | Buyer | Sale Price | Title Company |
|---|---|---|---|
| Williams Justin | $52,000 | Chiligiris Andrew P | |
| Williams Justin | $52,000 | Chiligiris Andrew P | |
| Quark Llc | -- | Chiligiris Andrew P | |
| Quark Llc | -- | Chiligiris Andrew P | |
| Quark Llc | $52,000 | None Available | |
| Groesch Robert | -- | -- |
Source: Public Records
Mortgage History
| Date | Status | Borrower | Loan Amount |
|---|---|---|---|
| Open | Williams Justin | $39,000 | |
| Closed | Williams Justin | $39,000 |
Source: Public Records
Tax History Compared to Growth
Tax History
| Year | Tax Paid | Tax Assessment Tax Assessment Total Assessment is a certain percentage of the fair market value that is determined by local assessors to be the total taxable value of land and additions on the property. | Land | Improvement |
|---|---|---|---|---|
| 2024 | $2,465 | $25,462 | $8,659 | $16,803 |
| 2023 | $2,444 | $24,560 | $8,352 | $16,208 |
| 2022 | $2,324 | $22,726 | $7,728 | $14,998 |
| 2021 | $2,184 | $21,225 | $7,218 | $14,007 |
| 2020 | $3,446 | $32,409 | $2,728 | $29,681 |
| 2019 | $3,446 | $32,409 | $2,728 | $29,681 |
| 2018 | $3,416 | $32,516 | $2,737 | $29,779 |
| 2017 | $3,497 | $33,384 | $2,810 | $30,574 |
| 2016 | $3,563 | $33,725 | $2,839 | $30,886 |
| 2015 | $2,314 | $22,638 | $2,789 | $19,849 |
| 2014 | $2,748 | $28,670 | $11,497 | $17,173 |
| 2013 | $2,840 | $29,747 | $11,929 | $17,818 |
Source: Public Records
Map
Nearby Homes
- 1740 S Fairview Ave
- 636 S Sycamore St
- 4220 S Lake Ct
- 1677 W Sunset Ave
- 51 Medial Dr
- 134 Madison Dr
- 1739 Moorwood Dr
- 650 S Crea St
- 1391 W Decatur St
- 15 Calumet Rd
- 2705 S Taylor Rd
- 365 S Taylor Ave
- 344 W Imboden Dr
- 2207 Forest Crest Dr
- 1527 W Macon St
- 628 W Forest Ave
- 441 S Seigel St
- 580 Powers Ln
- 530 Powers Ln
- 617 W Decatur St
- 1725 S Fairview Ave
- 1620 S Taylorville Rd
- 1760 S Fairview Ave
- 1624 S Taylorville Rd
- 1765 S Fairview Rd
- 1740 S Fairview Ave Unit 1760
- 1641 S Taylorville Rd
- 1661 S Taylorville Rd
- 1630 S Taylorville Rd
- 1316 W Sesom Dr
- 1326 W Sesom Dr
- 1330 W Sesom Dr
- 1340 W Sesom Dr
- 1321 W Sesom Dr
- 1801 S Fairview Ave
- 1801 S Fairview Ave
- 1331 W Sesom Dr
- 1350 W Sesom Dr
- 1525 S Fairview Ave
- 1341 W Sesom Dr