Estimated Value: $222,000 - $289,685
3
Beds
2
Baths
1,852
Sq Ft
$139/Sq Ft
Est. Value
About This Home
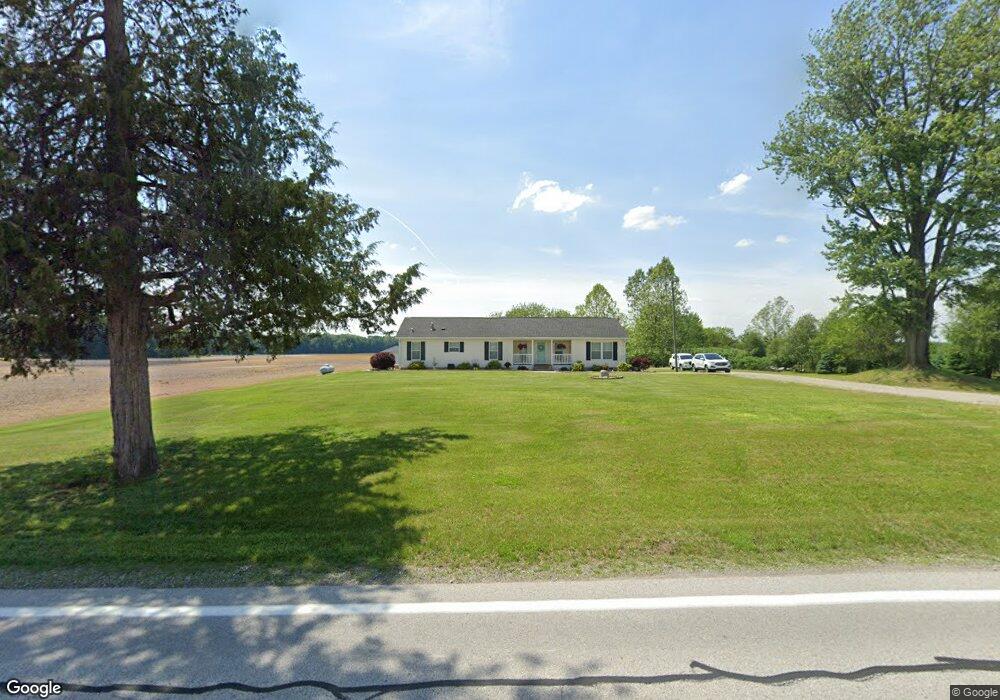
This home is located at 1725 State Route 109, Delta, OH 43515 and is currently estimated at $256,671, approximately $138 per square foot. 1725 State Route 109 is a home located in Fulton County with nearby schools including Delta Elementary School, Pike-Delta-York Middle School, and Pike-Delta-York High School.
Ownership History
Date
Name
Owned For
Owner Type
Purchase Details
Closed on
Nov 29, 2016
Sold by
Pant Claudia M
Bought by
Sexton Jack L and Sexton Kelly S
Current Estimated Value
Home Financials for this Owner
Home Financials are based on the most recent Mortgage that was taken out on this home.
Original Mortgage
$121,125
Outstanding Balance
$97,655
Interest Rate
3.47%
Mortgage Type
New Conventional
Estimated Equity
$159,016
Purchase Details
Closed on
May 19, 2010
Sold by
Schroeder Krystal M and Schroeder Matthew A
Bought by
Pant Gale L and Pant Claudia M
Purchase Details
Closed on
Jun 6, 2005
Sold by
Pant Gale L and Pant Claudia M
Bought by
Pant Krystal M and Schroeder Matthew A
Home Financials for this Owner
Home Financials are based on the most recent Mortgage that was taken out on this home.
Original Mortgage
$80,000
Interest Rate
5.91%
Mortgage Type
Construction
Purchase Details
Closed on
Dec 4, 2004
Sold by
Rochowiak Jackie Mae
Bought by
Pant Gale L and Pant Claudia M
Purchase Details
Closed on
Jan 1, 1990
Bought by
Rochowiak Jackie Mae
Create a Home Valuation Report for This Property
The Home Valuation Report is an in-depth analysis detailing your home's value as well as a comparison with similar homes in the area
Home Values in the Area
Average Home Value in this Area
Purchase History
| Date | Buyer | Sale Price | Title Company |
|---|---|---|---|
| Sexton Jack L | $127,500 | Attorney | |
| Pant Gale L | -- | Attorney | |
| Pant Krystal M | -- | -- | |
| Pant Gale L | $40,000 | -- | |
| Rochowiak Jackie Mae | -- | -- |
Source: Public Records
Mortgage History
| Date | Status | Borrower | Loan Amount |
|---|---|---|---|
| Open | Sexton Jack L | $121,125 | |
| Closed | Pant Krystal M | $80,000 |
Source: Public Records
Tax History Compared to Growth
Tax History
| Year | Tax Paid | Tax Assessment Tax Assessment Total Assessment is a certain percentage of the fair market value that is determined by local assessors to be the total taxable value of land and additions on the property. | Land | Improvement |
|---|---|---|---|---|
| 2024 | $2,902 | $74,730 | $19,670 | $55,060 |
| 2023 | $2,902 | $74,730 | $19,670 | $55,060 |
| 2022 | $3,043 | $60,410 | $16,380 | $44,030 |
| 2021 | $3,081 | $60,410 | $16,380 | $44,030 |
| 2020 | $3,113 | $60,410 | $16,380 | $44,030 |
| 2019 | $2,580 | $52,090 | $13,830 | $38,260 |
| 2018 | $2,584 | $53,070 | $13,830 | $39,240 |
| 2017 | $2,552 | $53,070 | $13,830 | $39,240 |
| 2016 | $2,581 | $50,480 | $13,830 | $36,650 |
| 2015 | $2,461 | $50,480 | $13,830 | $36,650 |
| 2014 | $2,456 | $50,480 | $13,830 | $36,650 |
| 2013 | $2,069 | $41,760 | $12,010 | $29,750 |
Source: Public Records
Map
Nearby Homes
- 1797 County Road 5
- 384 Douglas Dr
- 366 Douglas Dr
- 664 Ariel Ct
- 2121 County Road 4
- 2872 County Road 11
- U105 County Road 10
- 106 High St
- 600 North St
- 3466 County Road V
- 2239 County Road 3
- 4329 County Road 1 #2
- 518 Providence St
- 970 County Road 3
- 701 Palmwood St
- 207 Wood St
- 305 Mckinley St
- 308 Monroe St
- 201 Elmwood Ave
- 2511 County Road D
- 1772 State Route 109
- 1852 State Route 109
- 1903 State Route 109
- 1937 State Route 109
- 1451 State Route 109
- 7571 County Road B
- 7571 Co Rd B
- 1991 State Route 109
- 7605 County Road B
- 1431 State Route 109
- 2040 State Route 109
- 7400 County Road B
- 2109 State Route 109
- 7300 County Road B
- 7350 County Road B
- 7855 County Road B
- 7270 County Road B
- 2147 State Route 109
- 2148 State Route 109
- 1445 County Road 7