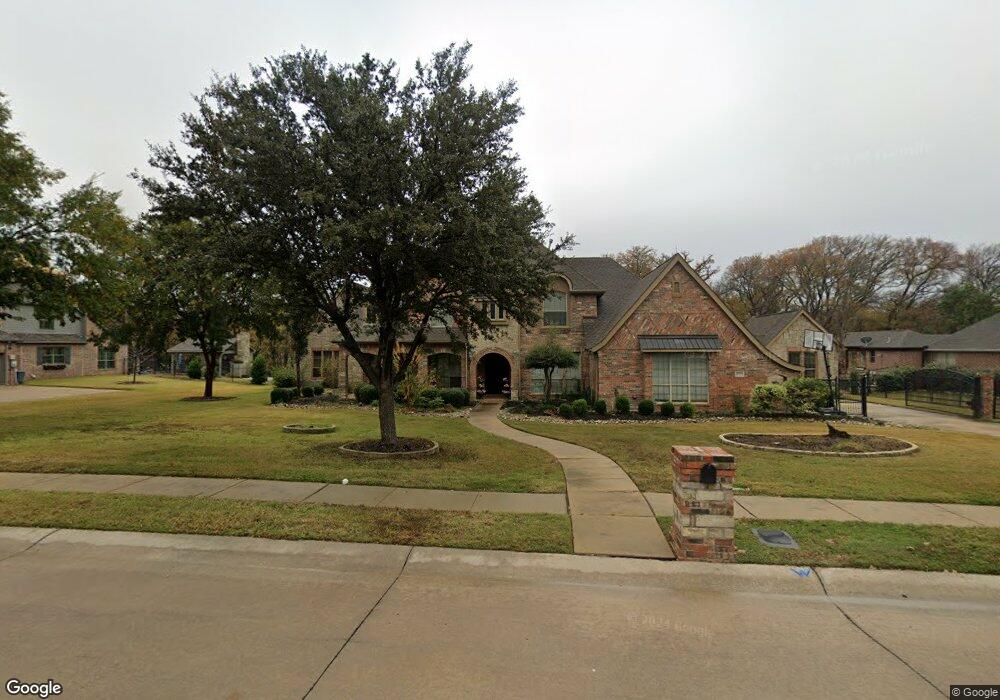
1725 Weeping Willow Way Southlake, TX 76092
Estimated Value: $1,806,000 - $1,810,662
5
Beds
5
Baths
5,122
Sq Ft
$353/Sq Ft
Est. Value
About This Home
This home is located at 1725 Weeping Willow Way, Southlake, TX 76092 and is currently estimated at $1,808,331, approximately $353 per square foot. 1725 Weeping Willow Way is a home located in Tarrant County with nearby schools including Carroll Elementary School, Eubanks Intermediate School, and George Dawson Middle School.
Ownership History
Date
Name
Owned For
Owner Type
Purchase Details
Closed on
Aug 31, 2023
Sold by
Jamshed Mohammad Khawar and Jamshed Lubna Khawar
Bought by
Jamshed Family Trust and Jamshed
Current Estimated Value
Purchase Details
Closed on
Apr 27, 2015
Sold by
Kendzior Elisabeth M and Kendzior Russell J
Bought by
Jamshed Mohammad K
Home Financials for this Owner
Home Financials are based on the most recent Mortgage that was taken out on this home.
Original Mortgage
$580,000
Interest Rate
3.84%
Mortgage Type
New Conventional
Purchase Details
Closed on
Oct 17, 2002
Sold by
Southlake Woods Lp
Bought by
Kendzior Russell J and Kendzior Elisabeth M
Home Financials for this Owner
Home Financials are based on the most recent Mortgage that was taken out on this home.
Original Mortgage
$300,700
Interest Rate
6.13%
Create a Home Valuation Report for This Property
The Home Valuation Report is an in-depth analysis detailing your home's value as well as a comparison with similar homes in the area
Home Values in the Area
Average Home Value in this Area
Purchase History
| Date | Buyer | Sale Price | Title Company |
|---|---|---|---|
| Jamshed Family Trust | -- | None Listed On Document | |
| Jamshed Mohammad K | -- | Multiple | |
| Kendzior Russell J | -- | Stewart Title |
Source: Public Records
Mortgage History
| Date | Status | Borrower | Loan Amount |
|---|---|---|---|
| Previous Owner | Jamshed Mohammad K | $580,000 | |
| Previous Owner | Kendzior Russell J | $300,700 | |
| Closed | Kendzior Russell J | $68,100 |
Source: Public Records
Tax History Compared to Growth
Tax History
| Year | Tax Paid | Tax Assessment Tax Assessment Total Assessment is a certain percentage of the fair market value that is determined by local assessors to be the total taxable value of land and additions on the property. | Land | Improvement |
|---|---|---|---|---|
| 2025 | $18,595 | $1,522,244 | $501,172 | $1,021,072 |
| 2024 | $18,595 | $1,573,485 | $501,172 | $1,072,313 |
| 2023 | $20,091 | $1,597,395 | $501,172 | $1,096,223 |
| 2022 | $21,619 | $1,203,304 | $358,269 | $845,035 |
| 2021 | $20,771 | $911,000 | $358,269 | $552,731 |
| 2020 | $21,306 | $926,905 | $429,115 | $497,790 |
| 2019 | $22,917 | $946,387 | $429,115 | $517,272 |
| 2018 | $24,246 | $1,001,262 | $429,115 | $572,147 |
| 2017 | $20,224 | $815,954 | $251,700 | $564,254 |
| 2016 | $19,910 | $803,271 | $252,125 | $551,146 |
| 2015 | -- | $665,000 | $90,000 | $575,000 |
| 2014 | -- | $717,500 | $90,000 | $627,500 |
Source: Public Records
Map
Nearby Homes
- 945 Deer Hollow Blvd
- 1010 Deer Hollow Blvd
- 1904 Cresson Dr
- 1205 Scenic Dr
- 1002 Chimney Hill Trail
- 1206 Oakwood Trail
- 710 Deer Hollow Blvd
- 1212 Oakwood Trail
- 690 S Peytonville Ave
- 929 Winding Ridge Trail
- 3325 Creek Rd
- 1005 Siena Dr
- 1196 W Continental Blvd
- 2401 Lower Brook Ct
- 7702 Tillman Hill Rd
- 7511 Mount Vernon Dr
- 503 Indian Paintbrush Way
- 2525 Park Grove Loop
- 606 Eagle Ct
- 2616 Park Grove Loop
- 1715 Weeping Willow Way
- 1735 Weeping Willow Way
- 1705 Weeping Willow Way
- 1730 Weeping Willow Way
- 1720 Weeping Willow Way
- 1740 Weeping Willow Way
- 1700 Weeping Willow Way
- 1015 Deer Hollow Blvd
- 1710 Weeping Willow Way
- 1025 Deer Hollow Blvd
- 1000 S Peytonville Ave
- 1005 Deer Hollow Blvd
- 1002 Shadywood Ct
- 1015 S Peytonville Ave
- 1000 Shadywood Ct
- 935 Deer Hollow Blvd
- 1100 Deer Hollow Blvd
- 910 Shadywood St
- 1000 Deer Hollow Blvd
- 1202 Scenic Dr