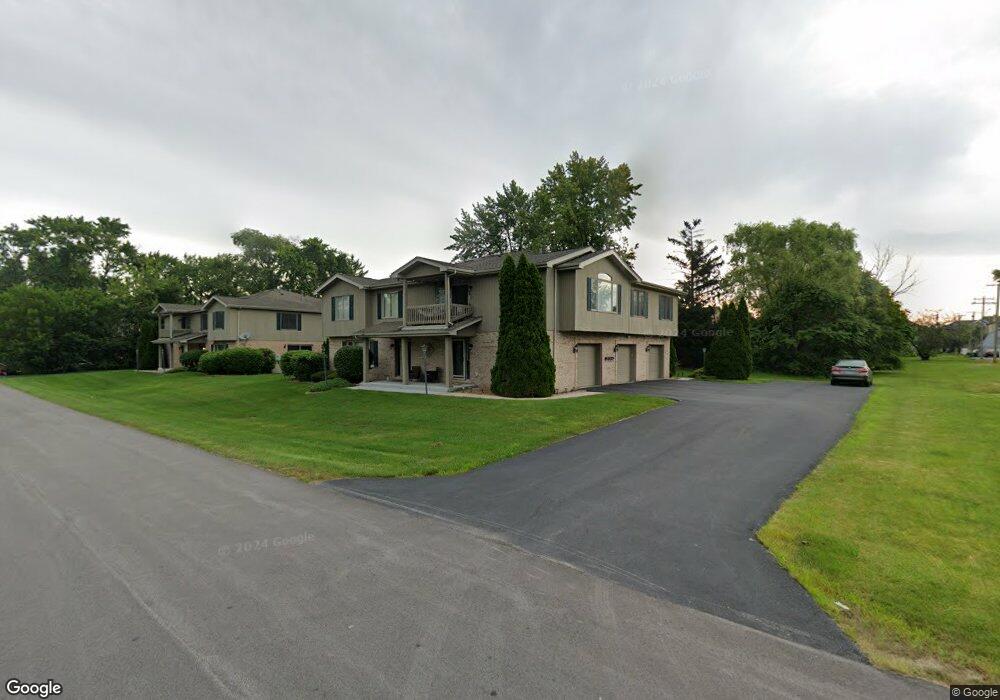
17251 65th Ave Unit 2C Tinley Park, IL 60477
Vogts Tinley Park Acres NeighborhoodEstimated Value: $222,000 - $277,000
2
Beds
2
Baths
1,500
Sq Ft
$167/Sq Ft
Est. Value
About This Home
This home is located at 17251 65th Ave Unit 2C, Tinley Park, IL 60477 and is currently estimated at $250,361, approximately $166 per square foot. 17251 65th Ave Unit 2C is a home located in Cook County with nearby schools including Memorial Elementary School, Central Middle School, and Tinley Park High School.
Ownership History
Date
Name
Owned For
Owner Type
Purchase Details
Closed on
Jul 20, 2021
Sold by
Roberts Britt E and Roberts Matthew
Bought by
Howard Chanel A
Current Estimated Value
Home Financials for this Owner
Home Financials are based on the most recent Mortgage that was taken out on this home.
Original Mortgage
$180,025
Outstanding Balance
$164,491
Interest Rate
3.37%
Mortgage Type
New Conventional
Estimated Equity
$85,870
Purchase Details
Closed on
Apr 18, 2014
Sold by
Casteneda Raul
Bought by
Johnson Britt E
Home Financials for this Owner
Home Financials are based on the most recent Mortgage that was taken out on this home.
Original Mortgage
$119,700
Interest Rate
4.41%
Mortgage Type
New Conventional
Purchase Details
Closed on
Aug 24, 2012
Sold by
Murillo Naela
Bought by
Castaneda Raul
Purchase Details
Closed on
Dec 20, 1996
Sold by
Standard Bank & Trust Company
Bought by
Murillo Naela
Home Financials for this Owner
Home Financials are based on the most recent Mortgage that was taken out on this home.
Original Mortgage
$86,900
Interest Rate
7.64%
Create a Home Valuation Report for This Property
The Home Valuation Report is an in-depth analysis detailing your home's value as well as a comparison with similar homes in the area
Home Values in the Area
Average Home Value in this Area
Purchase History
| Date | Buyer | Sale Price | Title Company |
|---|---|---|---|
| Howard Chanel A | $189,500 | Fidelity National Title | |
| Johnson Britt E | $133,000 | First American Title | |
| Castaneda Raul | $86,000 | Chicago Title Insurance Comp | |
| Murillo Naela | $116,000 | -- |
Source: Public Records
Mortgage History
| Date | Status | Borrower | Loan Amount |
|---|---|---|---|
| Open | Howard Chanel A | $180,025 | |
| Previous Owner | Johnson Britt E | $119,700 | |
| Previous Owner | Murillo Naela | $86,900 |
Source: Public Records
Tax History Compared to Growth
Tax History
| Year | Tax Paid | Tax Assessment Tax Assessment Total Assessment is a certain percentage of the fair market value that is determined by local assessors to be the total taxable value of land and additions on the property. | Land | Improvement |
|---|---|---|---|---|
| 2024 | $5,318 | $18,950 | $1,416 | $17,534 |
| 2023 | $4,515 | $18,950 | $1,416 | $17,534 |
| 2022 | $4,515 | $10,601 | $1,888 | $8,713 |
| 2021 | $3,064 | $10,599 | $1,887 | $8,712 |
| 2020 | $3,136 | $10,599 | $1,887 | $8,712 |
| 2019 | $3,327 | $11,331 | $1,730 | $9,601 |
| 2018 | $3,290 | $11,331 | $1,730 | $9,601 |
| 2017 | $4,752 | $11,331 | $1,730 | $9,601 |
| 2016 | $3,670 | $8,480 | $1,494 | $6,986 |
| 2015 | $3,598 | $8,480 | $1,494 | $6,986 |
| 2014 | $3,559 | $8,480 | $1,494 | $6,986 |
| 2013 | $3,548 | $9,264 | $1,494 | $7,770 |
Source: Public Records
Map
Nearby Homes
- 17218 Ridgeland Ave Unit 3-S
- 6520 173rd Place
- 17325 Roscommon Rd
- 17334 Ridgeland Ave
- LINCOLN Plan at Oak Ridge - Townhomes
- GARFIELD Plan at Oak Ridge - Townhomes
- 17309 Ulster Dr
- 17313 Ulster Dr
- 17315 Ulster Dr
- 17317 Ulster Dr
- 17319 Ulster Dr
- 17321 Ulster Dr
- 17323 Ulster Dr
- 17325 Ulster Dr
- 17329 Ulster Dr
- 17327 Ulster Dr
- 17331 Ulster Dr
- 6363 Ulster Dr
- 6333 Ulster Dr
- 6361 Ulster Dr
- 17251 65th Ave Unit C
- 17251 65th Ave Unit 2B
- 17241 65th Ave Unit A
- 17241 65th Ave Unit 1B
- 17241 65th Ave Unit 2A
- 17241 65th Ave Unit 1A
- 17241 65th Ave Unit 1C
- 17241 65th Ave Unit B
- 17250 65th Ave
- 17301 65th Ave
- 6443 Oak Forest Ave Unit 633
- 6443 Oak Forest Ave Unit 623
- 6443 Oak Forest Ave Unit 613
- 6443 Oak Forest Ave Unit 634
- 6443 Oak Forest Ave Unit 624
- 6443 Oak Forest Ave Unit 614
- 6443 Oak Forest Ave Unit 3W
- 6443 Oak Forest Ave Unit 2E
- 6437 Oak Forest Ave Unit 3E
- 6437 Oak Forest Ave Unit 631