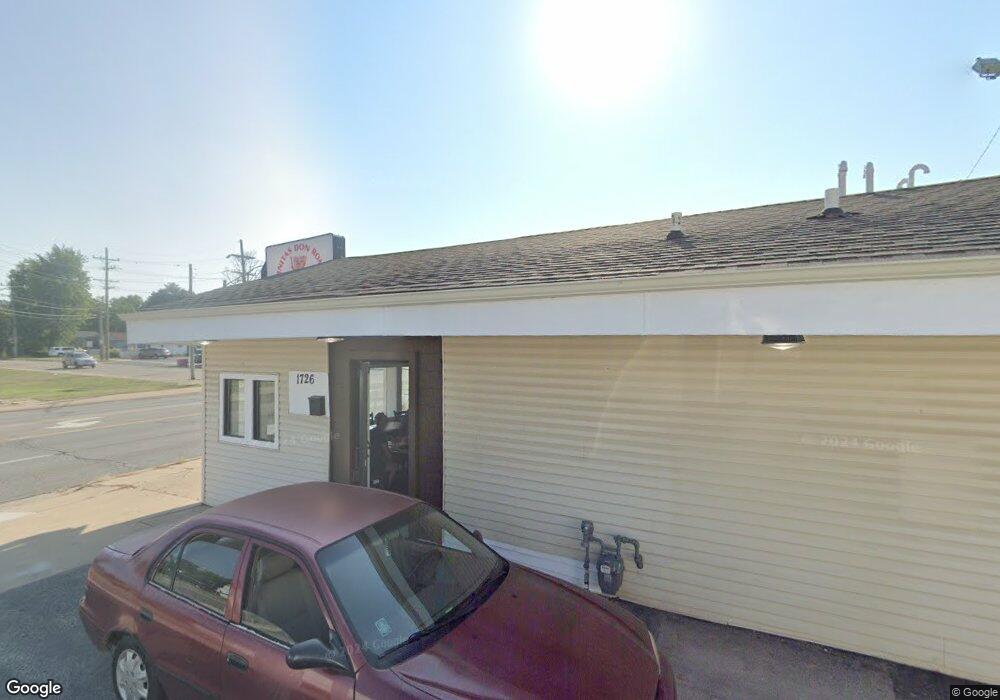
1726 Belvidere Rd Waukegan, IL 60085
West Waukegan NeighborhoodEstimated Value: $242,419
--
Bed
--
Bath
1,000
Sq Ft
$242/Sq Ft
Est. Value
About This Home
This home is located at 1726 Belvidere Rd, Waukegan, IL 60085 and is currently estimated at $242,419, approximately $242 per square foot. 1726 Belvidere Rd is a home located in Lake County with nearby schools including Washington Elementary School, Robert E. Abbott Middle School, and Waukegan High School.
Ownership History
Date
Name
Owned For
Owner Type
Purchase Details
Closed on
Oct 2, 2023
Sold by
Shavers James L and Shavers Roslynd R
Bought by
Roman Domingo and Roman Melina
Current Estimated Value
Purchase Details
Closed on
Jan 31, 2005
Sold by
Mutter Mohammed
Bought by
Shavers James L and Shavers Roslynd R
Home Financials for this Owner
Home Financials are based on the most recent Mortgage that was taken out on this home.
Original Mortgage
$105,000
Interest Rate
6.98%
Mortgage Type
Commercial
Purchase Details
Closed on
Sep 30, 1998
Sold by
Papadopoulos John and Papadopoulos Michelle G
Bought by
Mutter Mohammed
Home Financials for this Owner
Home Financials are based on the most recent Mortgage that was taken out on this home.
Original Mortgage
$74,000
Interest Rate
6.97%
Mortgage Type
Commercial
Create a Home Valuation Report for This Property
The Home Valuation Report is an in-depth analysis detailing your home's value as well as a comparison with similar homes in the area
Home Values in the Area
Average Home Value in this Area
Purchase History
| Date | Buyer | Sale Price | Title Company |
|---|---|---|---|
| Roman Domingo | $200,000 | Chicago Title | |
| Shavers James L | $140,000 | First American Title Ins Co | |
| Mutter Mohammed | $74,000 | -- |
Source: Public Records
Mortgage History
| Date | Status | Borrower | Loan Amount |
|---|---|---|---|
| Previous Owner | Shavers James L | $105,000 | |
| Previous Owner | Mutter Mohammed | $74,000 |
Source: Public Records
Tax History Compared to Growth
Tax History
| Year | Tax Paid | Tax Assessment Tax Assessment Total Assessment is a certain percentage of the fair market value that is determined by local assessors to be the total taxable value of land and additions on the property. | Land | Improvement |
|---|---|---|---|---|
| 2024 | $4,045 | $44,859 | $11,858 | $33,001 |
| 2023 | $4,051 | $42,892 | $11,338 | $31,554 |
| 2022 | $4,051 | $41,433 | $10,798 | $30,635 |
| 2021 | $4,282 | $41,072 | $10,704 | $30,368 |
| 2020 | $4,337 | $38,263 | $9,972 | $28,291 |
| 2019 | $4,365 | $35,062 | $9,138 | $25,924 |
| 2018 | $4,471 | $34,578 | $9,013 | $25,565 |
| 2017 | $4,352 | $30,592 | $7,974 | $22,618 |
| 2016 | $4,108 | $26,583 | $6,929 | $19,654 |
| 2015 | $4,019 | $23,793 | $6,202 | $17,591 |
| 2014 | $4,076 | $24,094 | $6,280 | $17,814 |
| 2012 | $4,755 | $26,104 | $6,804 | $19,300 |
Source: Public Records
Map
Nearby Homes
- 12601 W Atlantic Ave
- 2116 & 2101 Williamsburg Dr
- 446 S Jackson St
- 49 S Lewis Ave
- 1521 Catalpa Ave
- 819 S Fulton Ave
- 910 Cummings Ave
- 304 Powell Ave
- 1416 Hamilton Ct
- 408 Besley Place
- 2726 W Hidden Glen Dr
- 305 Besley Place
- 600 Sunderlin St
- 1712 11th St
- 613 Clarke Ave
- 23 N Jackson St
- 522 George Ave
- 815 Prescott St
- 515 George Ave
- 610 Bluff St
- 1730 Belvidere Rd
- 521 S Elmwood Ave
- 519 S Elmwood Ave
- 515 S Elmwood Ave
- 511 S Elmwood Ave
- 1710 Belvidere Rd
- 509 S Elmwood Ave
- 1721 Dodge Ave
- 1717 Dodge Ave
- 505 S Elmwood Ave
- 1801 Belvidere Rd
- 1723 Dodge Ave
- 514 S Fulton Ave
- 541 1/2 S Elmwood Ave
- 541 S Elmwood Ave
- 1705 Belvidere Rd
- 514 S Elmwood Ave
- 501 S Elmwood Ave
- 510 S Fulton Ave
- 510 S Elmwood Ave