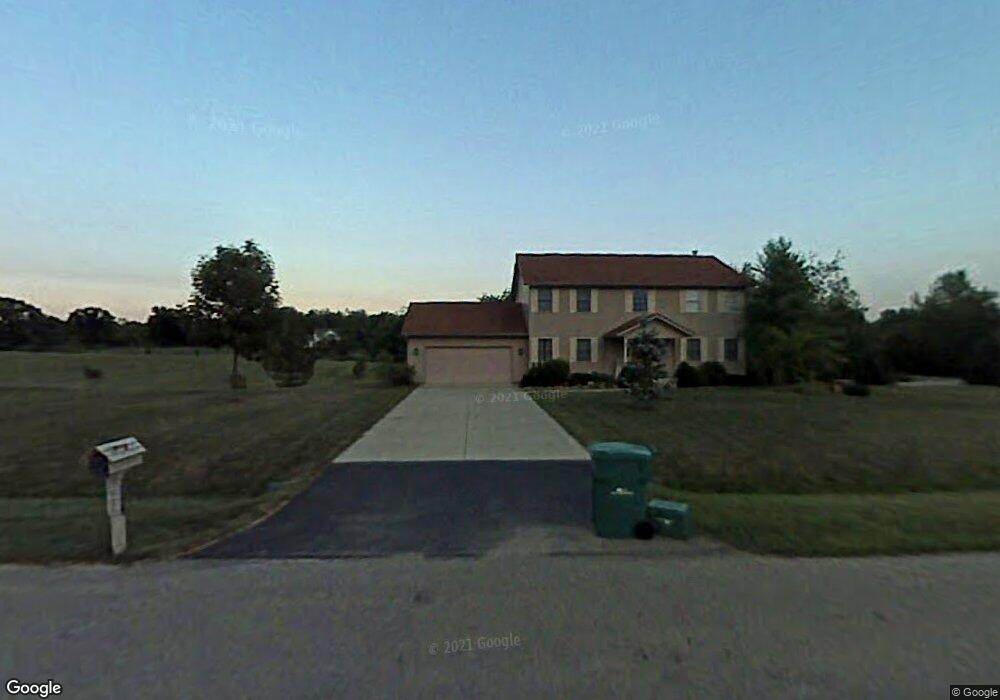
1726 Cranbrook Dr New Carlisle, OH 45344
Estimated Value: $428,665 - $478,000
3
Beds
3
Baths
2,460
Sq Ft
$183/Sq Ft
Est. Value
About This Home
This home is located at 1726 Cranbrook Dr, New Carlisle, OH 45344 and is currently estimated at $450,666, approximately $183 per square foot. 1726 Cranbrook Dr is a home located in Clark County with nearby schools including Northwestern Elementary School and Northwestern Junior/Senior High School.
Ownership History
Date
Name
Owned For
Owner Type
Purchase Details
Closed on
Jul 30, 2025
Sold by
Jensen Eric E and Jensen Connie S
Bought by
Mcdonald William and Mcdonald Ellise
Current Estimated Value
Purchase Details
Closed on
Apr 4, 2006
Sold by
Bowers Darrell M and Bowers Dorothy Kay
Bought by
Jensen Eric E and Jensen Connie S
Home Financials for this Owner
Home Financials are based on the most recent Mortgage that was taken out on this home.
Original Mortgage
$85,000
Interest Rate
6.33%
Mortgage Type
Fannie Mae Freddie Mac
Purchase Details
Closed on
Feb 16, 1999
Sold by
Muterspaw Marilyn
Bought by
Bowers Darrell M and Bowers Dorothy Kay
Home Financials for this Owner
Home Financials are based on the most recent Mortgage that was taken out on this home.
Original Mortgage
$128,000
Interest Rate
6.88%
Create a Home Valuation Report for This Property
The Home Valuation Report is an in-depth analysis detailing your home's value as well as a comparison with similar homes in the area
Home Values in the Area
Average Home Value in this Area
Purchase History
| Date | Buyer | Sale Price | Title Company |
|---|---|---|---|
| Mcdonald William | $440,000 | Sterling Land Title | |
| Mcdonald William | $440,000 | Sterling Land Title | |
| Jensen Eric E | $235,000 | None Available | |
| Bowers Darrell M | $192,500 | -- |
Source: Public Records
Mortgage History
| Date | Status | Borrower | Loan Amount |
|---|---|---|---|
| Previous Owner | Jensen Eric E | $85,000 | |
| Previous Owner | Bowers Darrell M | $128,000 |
Source: Public Records
Tax History Compared to Growth
Tax History
| Year | Tax Paid | Tax Assessment Tax Assessment Total Assessment is a certain percentage of the fair market value that is determined by local assessors to be the total taxable value of land and additions on the property. | Land | Improvement |
|---|---|---|---|---|
| 2024 | $4,483 | $98,150 | $22,760 | $75,390 |
| 2023 | $4,483 | $98,150 | $22,760 | $75,390 |
| 2022 | $4,606 | $98,150 | $22,760 | $75,390 |
| 2021 | $4,068 | $77,050 | $17,640 | $59,410 |
| 2020 | $4,108 | $77,050 | $17,640 | $59,410 |
| 2019 | $4,071 | $77,050 | $17,640 | $59,410 |
| 2018 | $4,352 | $80,840 | $14,820 | $66,020 |
| 2017 | $4,354 | $76,073 | $14,819 | $61,254 |
| 2016 | $4,268 | $76,073 | $14,819 | $61,254 |
| 2015 | $4,016 | $69,787 | $14,112 | $55,675 |
| 2014 | $4,015 | $69,787 | $14,112 | $55,675 |
| 2013 | $3,988 | $69,787 | $14,112 | $55,675 |
Source: Public Records
Map
Nearby Homes
- 1650 Cranbrook Dr
- 1559 Folk Ream Rd
- 2430 Myers Rd
- 195 N Tecumseh Rd
- 7475 Detrick Jordan Pike
- 00 Folk Ream Rd
- 1 Folk Ream Rd
- 3172 Folk Ream Rd
- 96 Eastwood Dr
- 3000-3002 Shrine Rd
- 0 S Tecumseh Rd Unit 1042892
- 0 S Tecumseh Rd Unit 1042894
- 7588 Milton Carlisle Rd
- 4129 Grange Hall Rd
- 4638 W National Rd
- 7585 Wrenview Dr
- 419 Candace Dr
- 44 Apple Hill Dr
- 2601 Ballentine Pike
- 169 E Main St
- 1710 Cranbrook Dr
- 6420 Winding Tree Dr
- 6427 Greenridge Ave
- 6407 Greenridge Ave
- 1690 Cranbrook Dr
- 6367 Greenridge Ave
- 6397 Greenridge Ave
- 6426 Winding Tree Dr
- 6405 Winding Tree Dr
- 6433 Greenridge Ave
- 6351 Greenridge Ave
- 6411 Winding Tree Dr
- 6424 Greenridge Ave
- 6374 Greenridge Ave
- 6406 Greenridge Ave
- 6418 Greenridge Ave
- 6412 Greenridge Ave
- 6366 Greenridge Ave
- 6358 Greenridge Ave
- 6432 Winding Tree Dr