Estimated Value: $201,826 - $240,000
3
Beds
2
Baths
1,698
Sq Ft
$132/Sq Ft
Est. Value
About This Home
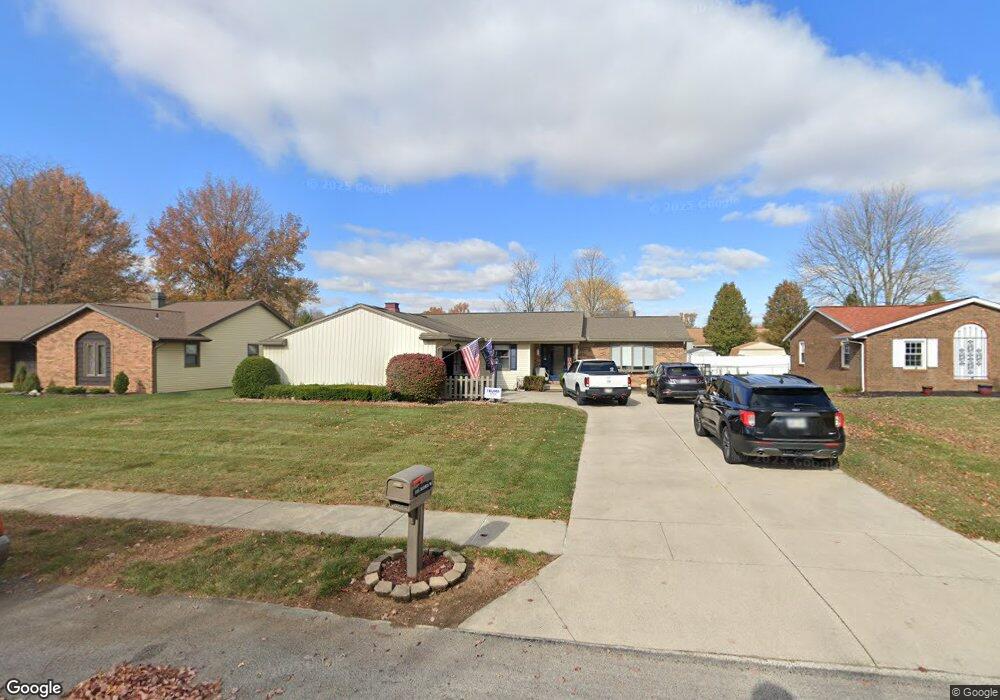
This home is located at 1726 Deerfield Dr, Lima, OH 45805 and is currently estimated at $224,457, approximately $132 per square foot. 1726 Deerfield Dr is a home located in Allen County with nearby schools including Elida Elementary School, Elida Middle School, and Elida High School.
Ownership History
Date
Name
Owned For
Owner Type
Purchase Details
Closed on
Jul 28, 2023
Sold by
Colley Kathleen A
Bought by
Murphy Timothy M and Murphy Kerri L
Current Estimated Value
Home Financials for this Owner
Home Financials are based on the most recent Mortgage that was taken out on this home.
Original Mortgage
$167,887
Outstanding Balance
$163,126
Interest Rate
6.69%
Mortgage Type
FHA
Estimated Equity
$61,331
Purchase Details
Closed on
Aug 1, 1978
Bought by
Stippich Alvira I
Create a Home Valuation Report for This Property
The Home Valuation Report is an in-depth analysis detailing your home's value as well as a comparison with similar homes in the area
Purchase History
| Date | Buyer | Sale Price | Title Company |
|---|---|---|---|
| Murphy Timothy M | $175,000 | None Listed On Document | |
| Stippich Alvira I | $63,700 | -- |
Source: Public Records
Mortgage History
| Date | Status | Borrower | Loan Amount |
|---|---|---|---|
| Open | Murphy Timothy M | $167,887 |
Source: Public Records
Tax History
| Year | Tax Paid | Tax Assessment Tax Assessment Total Assessment is a certain percentage of the fair market value that is determined by local assessors to be the total taxable value of land and additions on the property. | Land | Improvement |
|---|---|---|---|---|
| 2024 | $2,451 | $56,070 | $6,790 | $49,280 |
| 2023 | $2,179 | $44,180 | $5,360 | $38,820 |
| 2022 | $2,234 | $44,180 | $5,360 | $38,820 |
| 2021 | $2,230 | $44,180 | $5,360 | $38,820 |
| 2020 | $1,967 | $36,370 | $5,110 | $31,260 |
| 2019 | $1,967 | $36,370 | $5,110 | $31,260 |
| 2018 | $1,989 | $36,370 | $5,110 | $31,260 |
| 2017 | $1,731 | $32,730 | $5,110 | $27,620 |
| 2016 | $1,726 | $32,730 | $5,110 | $27,620 |
| 2015 | $1,663 | $32,730 | $5,110 | $27,620 |
| 2014 | $1,663 | $30,520 | $5,040 | $25,480 |
| 2013 | $1,494 | $30,520 | $5,040 | $25,480 |
Source: Public Records
Map
Nearby Homes
- 2113 Kimberly Dr
- 2129 Reinell Ave
- 1743 Sherry Lee Dr
- 1919 Jared Place
- 2630 Carolyn Dr
- 2718 Carolyn Dr
- 1883 Brookhaven Dr Unit 2
- 2225 N Cable Rd
- 1143 Brower Rd
- 00 Homeward Ave
- 2371 Mandolin Dr
- 1730 Homeward Ave
- 2300 Mandolin Dr
- 2380 Mandolin Dr
- 2275 N Cable Rd Unit 178
- 2275 N Cable Rd Unit 130
- 2275 N Cable Rd Unit 43 Unit Package
- 2275 N Cable Rd Unit 42
- 2275 N Cable Rd Unit 12
- 2275 N Cable Rd Unit 24
Your Personal Tour Guide
Ask me questions while you tour the home.