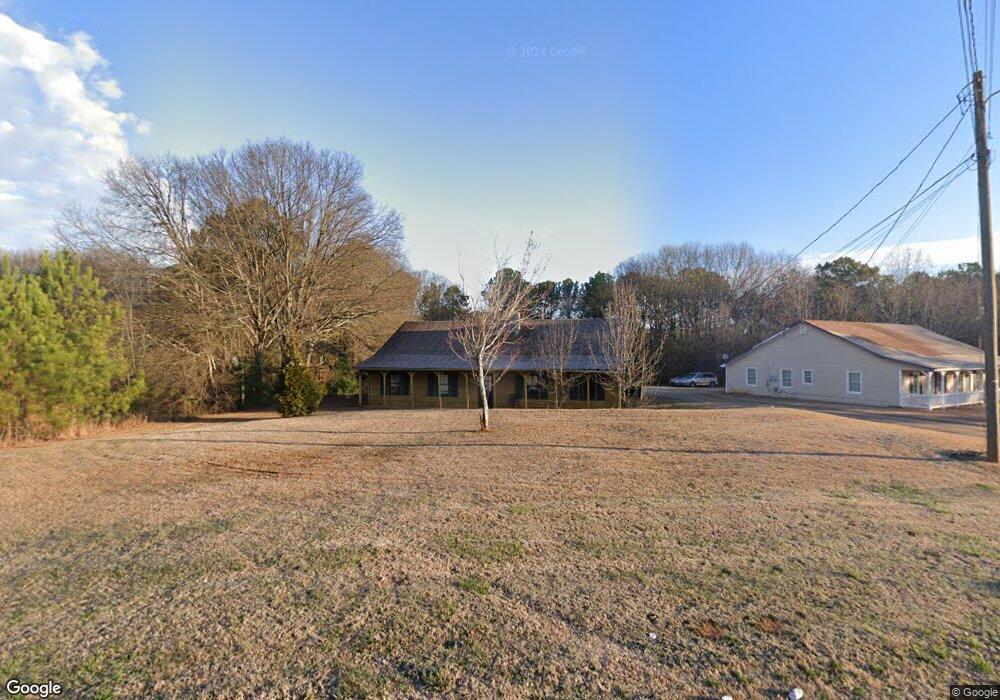
1726 Kirkland Rd Covington, GA 30016
Estimated Value: $175,000 - $245,000
Studio
2
Baths
1,998
Sq Ft
$107/Sq Ft
Est. Value
About This Home
This home is located at 1726 Kirkland Rd, Covington, GA 30016 and is currently estimated at $213,612, approximately $106 per square foot. 1726 Kirkland Rd is a home located in Newton County with nearby schools including West Newton Elementary School, Liberty Middle School, and Newton High School.
Ownership History
Date
Name
Owned For
Owner Type
Purchase Details
Closed on
May 30, 2025
Sold by
Hardee Jay E
Bought by
Hard Assets 2025 Llc
Current Estimated Value
Purchase Details
Closed on
Oct 29, 2010
Sold by
Gsaa Trust 2004-6
Bought by
Hardee Jay E
Purchase Details
Closed on
Jan 5, 2010
Sold by
Mccray Charles E
Bought by
Gsaa Trust 2004-6
Purchase Details
Closed on
Mar 11, 2004
Sold by
Grimes Michael
Bought by
Mccray Charles E
Home Financials for this Owner
Home Financials are based on the most recent Mortgage that was taken out on this home.
Original Mortgage
$90,400
Interest Rate
6.25%
Mortgage Type
New Conventional
Purchase Details
Closed on
Dec 16, 1999
Sold by
Havas Michael J and Havas Maggi E
Bought by
Grimes Michael and Grimes Olivia
Home Financials for this Owner
Home Financials are based on the most recent Mortgage that was taken out on this home.
Original Mortgage
$71,910
Interest Rate
7.67%
Mortgage Type
New Conventional
Create a Home Valuation Report for This Property
The Home Valuation Report is an in-depth analysis detailing your home's value as well as a comparison with similar homes in the area
Home Values in the Area
Average Home Value in this Area
Purchase History
| Date | Buyer | Sale Price | Title Company |
|---|---|---|---|
| Hard Assets 2025 Llc | $1,525,000 | -- | |
| Hardee Jay E | $24,000 | -- | |
| Gsaa Trust 2004-6 | $25,000 | -- | |
| Mccray Charles E | $113,000 | -- | |
| Grimes Michael | $79,900 | -- |
Source: Public Records
Mortgage History
| Date | Status | Borrower | Loan Amount |
|---|---|---|---|
| Previous Owner | Mccray Charles E | $90,400 | |
| Previous Owner | Mccray Charles E | $16,900 | |
| Previous Owner | Grimes Michael | $71,910 |
Source: Public Records
Tax History
| Year | Tax Paid | Tax Assessment Tax Assessment Total Assessment is a certain percentage of the fair market value that is determined by local assessors to be the total taxable value of land and additions on the property. | Land | Improvement |
|---|---|---|---|---|
| 2025 | $2,037 | $80,000 | $12,800 | $67,200 |
| 2024 | $1,043 | $39,320 | $4,277 | $35,043 |
| 2023 | $1,113 | $39,320 | $4,277 | $35,043 |
| 2022 | $1,113 | $39,320 | $6,400 | $32,920 |
| 2021 | $1,072 | $33,800 | $6,400 | $27,400 |
| 2020 | $1,059 | $31,520 | $6,173 | $25,347 |
| 2019 | $1,075 | $31,520 | $6,173 | $25,347 |
| 2018 | $541 | $31,520 | $6,400 | $25,120 |
| 2017 | $474 | $13,800 | $4,400 | $9,400 |
| 2016 | $446 | $13,000 | $3,600 | $9,400 |
| 2015 | $419 | $12,200 | $3,600 | $8,600 |
| 2014 | $417 | $12,200 | $0 | $0 |
Source: Public Records
Map
Nearby Homes
- 230 Mackenzie Ct
- 280 Mackenzie Ct
- 257 Pinewood Dr
- 408 Pinewood Dr
- 348 Pinewood Dr
- 2093 Blackbird Cir
- 285 Barshay Dr
- 3380 Salem Cove Way SE
- 230 Forest Brook Dr
- 3409 Salem Rd
- 65 Lakeridge Ct
- 1903 Old Concord Dr SE
- 2075 Pinewood Dr
- 175 Grosslake Pkwy
- 3789 Salem Rd
- 385 Creekview Blvd
- 210 Pinewood Dr
- 215 Pinewood Dr
- 740 Pebble Blvd
- 2180 E Chester Cir SE
- 1714 Kirkland Rd Unit A/B
- 1714 Kirkland Rd
- 1738 Kirkland Rd
- 1702 Kirkland Rd
- 1702 Kirkland Rd Unit B
- 75 Plum Orchard Rd
- 1750 Kirkland Rd
- 85 Plum Orchard Rd
- 65 Plum Orchard Rd
- 95 Plum Orchard Rd
- 1690 Kirkland Rd
- 1762 Kirkland Rd
- 245 Mackenzie Ct
- 265 Mackenzie Ct
- 285 Mackenzie Ct
- 235 Mackenzie Ct
- 55 Plum Orchard Rd
- 225 Mackenzie Ct
- 295 Mackenzie Ct
- 215 Mackenzie Ct
Your Personal Tour Guide
Ask me questions while you tour the home.