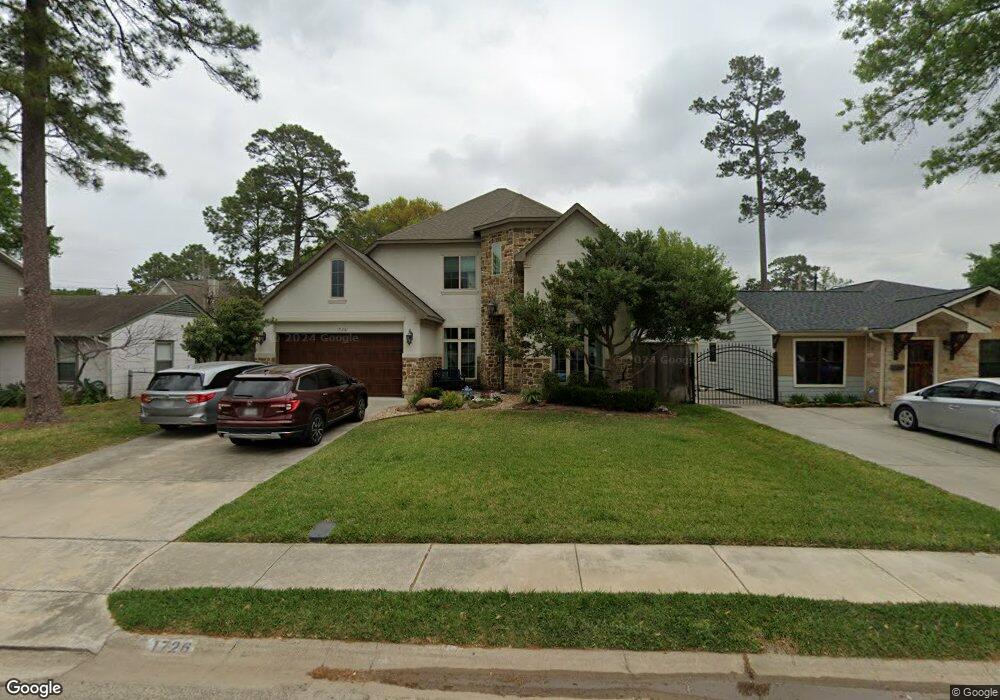
1726 Lamonte Ln Houston, TX 77018
Oak Forest-Garden Oaks NeighborhoodEstimated Value: $1,140,932 - $1,340,000
4
Beds
4
Baths
3,470
Sq Ft
$351/Sq Ft
Est. Value
About This Home
This home is located at 1726 Lamonte Ln, Houston, TX 77018 and is currently estimated at $1,217,983, approximately $351 per square foot. 1726 Lamonte Ln is a home located in Harris County with nearby schools including Stevens Elementary School, Frank Black Middle School, and Waltrip High School.
Ownership History
Date
Name
Owned For
Owner Type
Purchase Details
Closed on
Apr 10, 2015
Sold by
Eagle Point Homes Llc
Bought by
Dykhuizen Richard Charles and Dykhuizen Candice F
Current Estimated Value
Home Financials for this Owner
Home Financials are based on the most recent Mortgage that was taken out on this home.
Original Mortgage
$410,000
Outstanding Balance
$307,400
Interest Rate
3.12%
Mortgage Type
Adjustable Rate Mortgage/ARM
Estimated Equity
$910,583
Purchase Details
Closed on
Aug 12, 2013
Sold by
Robryan Construction Lp
Bought by
Eagle Point Homes Llc
Home Financials for this Owner
Home Financials are based on the most recent Mortgage that was taken out on this home.
Original Mortgage
$467,457
Interest Rate
4.34%
Mortgage Type
Future Advance Clause Open End Mortgage
Purchase Details
Closed on
Apr 30, 2013
Sold by
Scroggins George L
Bought by
Robryan Construction Lp
Purchase Details
Closed on
Feb 25, 1993
Sold by
Archer Everett E and Archer Cassandra
Bought by
Scroggins George L
Create a Home Valuation Report for This Property
The Home Valuation Report is an in-depth analysis detailing your home's value as well as a comparison with similar homes in the area
Home Values in the Area
Average Home Value in this Area
Purchase History
| Date | Buyer | Sale Price | Title Company |
|---|---|---|---|
| Dykhuizen Richard Charles | -- | South Land Title Llc | |
| Eagle Point Homes Llc | -- | South Land Title Llc | |
| Robryan Construction Lp | -- | Arcland Title | |
| Scroggins George L | -- | Regency Title |
Source: Public Records
Mortgage History
| Date | Status | Borrower | Loan Amount |
|---|---|---|---|
| Open | Dykhuizen Richard Charles | $410,000 | |
| Previous Owner | Eagle Point Homes Llc | $467,457 |
Source: Public Records
Tax History Compared to Growth
Tax History
| Year | Tax Paid | Tax Assessment Tax Assessment Total Assessment is a certain percentage of the fair market value that is determined by local assessors to be the total taxable value of land and additions on the property. | Land | Improvement |
|---|---|---|---|---|
| 2025 | $10,937 | $1,072,878 | $374,400 | $698,478 |
| 2024 | $10,937 | $1,090,735 | $352,800 | $737,935 |
| 2023 | $10,937 | $978,847 | $352,800 | $626,047 |
| 2022 | $19,435 | $907,738 | $309,600 | $598,138 |
| 2021 | $18,701 | $802,403 | $288,000 | $514,403 |
| 2020 | $19,373 | $800,000 | $288,000 | $512,000 |
| 2019 | $18,805 | $798,619 | $288,000 | $510,619 |
| 2018 | $13,443 | $675,604 | $288,000 | $387,604 |
| 2017 | $17,715 | $700,600 | $288,000 | $412,600 |
| 2016 | $18,876 | $746,500 | $288,000 | $458,500 |
| 2015 | $6,200 | $867,418 | $288,000 | $579,418 |
| 2014 | $6,200 | $241,180 | $230,400 | $10,780 |
Source: Public Records
Map
Nearby Homes
- 1721 Saxon Dr
- 1734 Lamonte Ln
- 1730 Chantilly Ln
- 1806 Gardenia Dr
- 1706 Hewitt Dr
- 1918 Gardenia Dr
- 1729 Wakefield Dr
- 1720 Libbey Dr
- 2007 Lamonte Ln
- 1570 Cheshire Ln
- 1741 Chippendale Rd
- 2019 Saxon Dr
- 1514 Gardenia Dr
- 1526 Wakefield Dr
- 2007 Hewitt Dr
- 1818 Nina Lee Ln
- 1826 Woodcrest Dr
- 1614 Woodcrest Dr
- 1910 Woodcrest Dr
- 1506 W 43rd St
- 1730 Lamonte Ln
- 1722 Lamonte Ln
- 1718 Lamonte Ln
- 1717 Saxon Dr
- 1725 Saxon Dr
- 1713 Saxon Dr
- 1714 Lamonte Ln
- 1729 Saxon Dr
- 1727 Lamonte Ln
- 1738 Lamonte Ln
- 1723 Lamonte Ln
- 1731 Lamonte Ln
- 1709 Saxon Dr
- 1719 Lamonte Ln
- 1733 Saxon Dr
- 1710 Lamonte Ln
- 1715 Lamonte Ln
- 1705 Saxon Dr
- 1739 Lamonte Ln
- 1711 Lamonte Ln