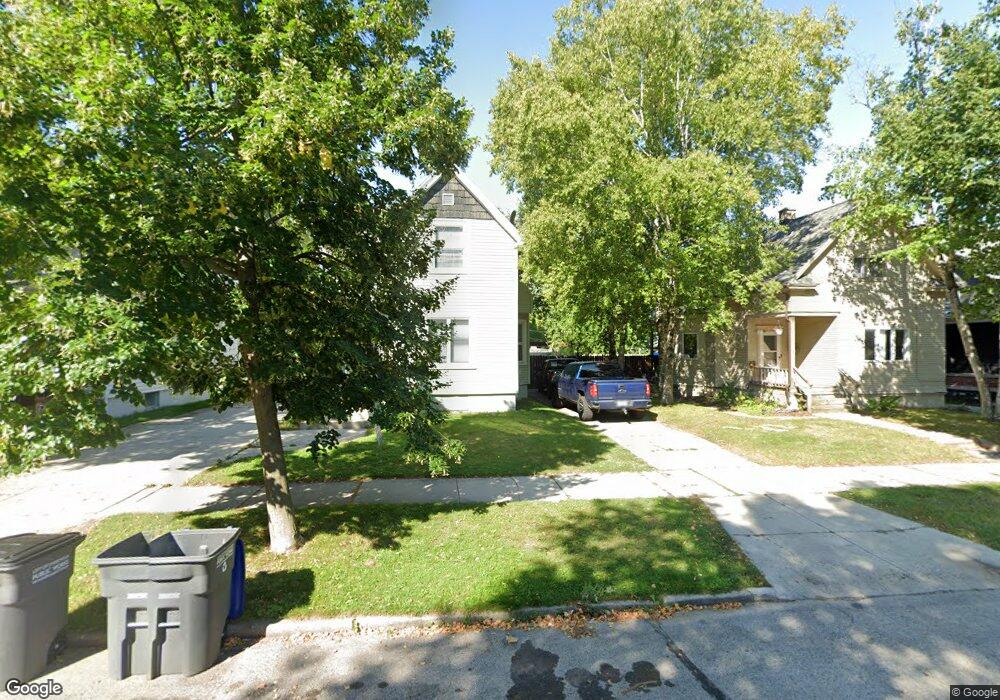
1726 N 9th St Sheboygan, WI 53081
Central Sheboygan NeighborhoodEstimated Value: $158,000 - $214,000
4
Beds
2
Baths
2,067
Sq Ft
$91/Sq Ft
Est. Value
About This Home
This home is located at 1726 N 9th St, Sheboygan, WI 53081 and is currently estimated at $187,088, approximately $90 per square foot. 1726 N 9th St is a home located in Sheboygan County with nearby schools including Grant Elementary School, Urban Middle School, and North High School.
Ownership History
Date
Name
Owned For
Owner Type
Purchase Details
Closed on
Feb 21, 2023
Sold by
Ace Property Acquisitions Llc
Bought by
Ylst Mathew and Perry Allison
Current Estimated Value
Purchase Details
Closed on
Feb 8, 2023
Sold by
Fireside Homes Llc
Bought by
Ace Property Acquisitions Llc
Purchase Details
Closed on
Mar 21, 2014
Sold by
Fireside Homes Llc
Bought by
The Bank Of New York Mellon Fka The Bank
Purchase Details
Closed on
Dec 5, 2013
Sold by
The Bank Of New York Mellon Fka The Bank
Bought by
Schultz Maria E
Create a Home Valuation Report for This Property
The Home Valuation Report is an in-depth analysis detailing your home's value as well as a comparison with similar homes in the area
Home Values in the Area
Average Home Value in this Area
Purchase History
| Date | Buyer | Sale Price | Title Company |
|---|---|---|---|
| Ylst Mathew | $205,000 | Merit Title | |
| Ace Property Acquisitions Llc | $160,000 | Merit Title | |
| The Bank Of New York Mellon Fka The Bank | $37,500 | -- | |
| Schultz Maria E | $54,500 | -- |
Source: Public Records
Tax History Compared to Growth
Tax History
| Year | Tax Paid | Tax Assessment Tax Assessment Total Assessment is a certain percentage of the fair market value that is determined by local assessors to be the total taxable value of land and additions on the property. | Land | Improvement |
|---|---|---|---|---|
| 2024 | $1,662 | $102,100 | $18,800 | $83,300 |
| 2023 | $1,514 | $86,400 | $18,000 | $68,400 |
| 2022 | $1,453 | $71,300 | $18,000 | $53,300 |
| 2021 | $1,186 | $47,600 | $15,700 | $31,900 |
| 2020 | $1,213 | $47,600 | $15,700 | $31,900 |
| 2019 | $1,161 | $47,600 | $15,700 | $31,900 |
| 2018 | $1,145 | $47,600 | $15,700 | $31,900 |
| 2017 | $1,109 | $47,600 | $15,700 | $31,900 |
| 2016 | $1,116 | $47,600 | $15,700 | $31,900 |
| 2015 | $1,159 | $47,600 | $15,700 | $31,900 |
| 2014 | $1,205 | $47,600 | $15,700 | $31,900 |
Source: Public Records
Map
Nearby Homes