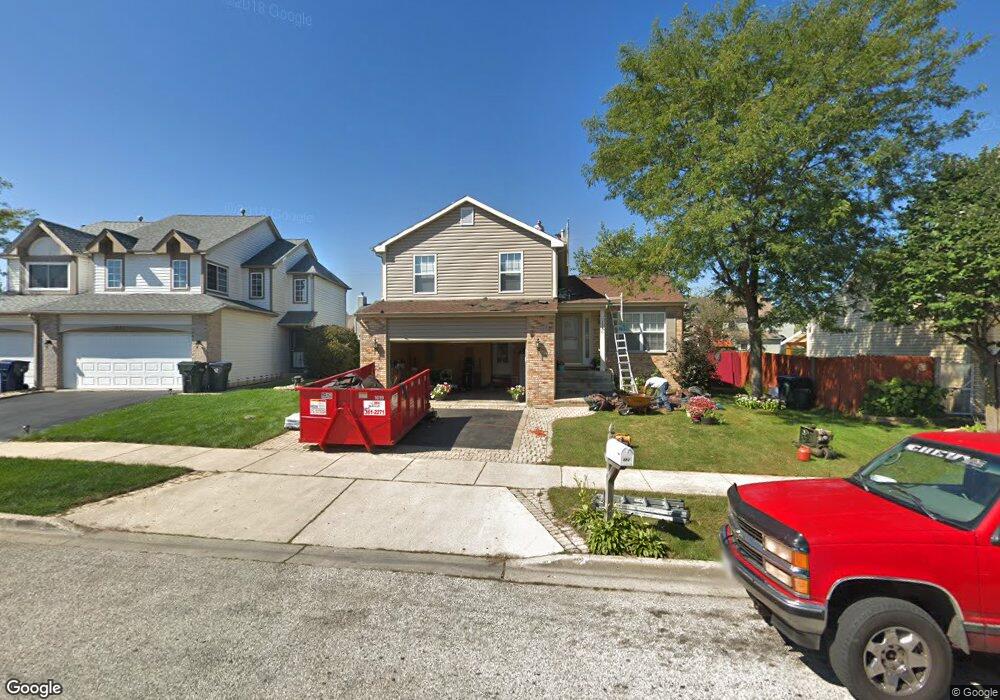
1726 N Frolic Ave Waukegan, IL 60085
Estimated Value: $285,000 - $329,000
3
Beds
3
Baths
1,500
Sq Ft
$202/Sq Ft
Est. Value
About This Home
This home is located at 1726 N Frolic Ave, Waukegan, IL 60085 and is currently estimated at $303,311, approximately $202 per square foot. 1726 N Frolic Ave is a home located in Lake County with nearby schools including Clearview Elementary School, Miguel Juarez Middle School, and Waukegan High School.
Ownership History
Date
Name
Owned For
Owner Type
Purchase Details
Closed on
Jul 29, 2015
Sold by
Bank Of America Na
Bought by
Arizmendi Fernando Enrique Diaz and Diaz Karina
Current Estimated Value
Purchase Details
Closed on
Mar 25, 2015
Sold by
Vega Juan
Bought by
Bank Of America Na
Purchase Details
Closed on
Jul 16, 2006
Sold by
Domingo Luisito C and Domingo Norina G
Bought by
Vega Juan
Home Financials for this Owner
Home Financials are based on the most recent Mortgage that was taken out on this home.
Original Mortgage
$207,075
Interest Rate
6.83%
Mortgage Type
FHA
Purchase Details
Closed on
Nov 15, 1997
Sold by
Parkway Bank & Trust Company
Bought by
Domingo Luisito C and Domingo Norina G
Home Financials for this Owner
Home Financials are based on the most recent Mortgage that was taken out on this home.
Original Mortgage
$134,450
Interest Rate
7.46%
Mortgage Type
FHA
Create a Home Valuation Report for This Property
The Home Valuation Report is an in-depth analysis detailing your home's value as well as a comparison with similar homes in the area
Home Values in the Area
Average Home Value in this Area
Purchase History
| Date | Buyer | Sale Price | Title Company |
|---|---|---|---|
| Arizmendi Fernando Enrique Diaz | $85,805 | Attorneys Title Guaranty Fun | |
| Bank Of America Na | -- | None Available | |
| Vega Juan | $210,000 | First American Title Ins Co | |
| Domingo Luisito C | $137,000 | Chicago Title Insurance Co |
Source: Public Records
Mortgage History
| Date | Status | Borrower | Loan Amount |
|---|---|---|---|
| Previous Owner | Vega Juan | $207,075 | |
| Previous Owner | Domingo Luisito C | $134,450 |
Source: Public Records
Tax History Compared to Growth
Tax History
| Year | Tax Paid | Tax Assessment Tax Assessment Total Assessment is a certain percentage of the fair market value that is determined by local assessors to be the total taxable value of land and additions on the property. | Land | Improvement |
|---|---|---|---|---|
| 2024 | $5,981 | $81,319 | $13,863 | $67,456 |
| 2023 | $5,871 | $71,431 | $12,190 | $59,241 |
| 2022 | $5,871 | $66,055 | $11,363 | $54,692 |
| 2021 | $5,534 | $59,077 | $10,135 | $48,942 |
| 2020 | $5,559 | $55,037 | $9,442 | $45,595 |
| 2019 | $5,542 | $50,432 | $8,652 | $41,780 |
| 2018 | $5,994 | $52,745 | $12,622 | $40,123 |
| 2017 | $5,785 | $46,665 | $11,167 | $35,498 |
| 2016 | $5,645 | $36,532 | $8,743 | $27,789 |
| 2015 | $4,510 | $32,697 | $7,825 | $24,872 |
| 2014 | $3,863 | $28,369 | $7,526 | $20,843 |
| 2012 | $5,007 | $30,736 | $8,155 | $22,581 |
Source: Public Records
Map
Nearby Homes
- 2810 W Atlantic Ave
- 2715 W Greenwood Ave
- 2928 W Country Club Ave
- 3000 W Country Club Ave
- 2946 W Country Club Ave
- 2813 Theresa Ave
- 2440 W Cheyenne Rd
- 1913 Chippewa Rd
- 3320 Sunset Ave
- 1430 N Green Bay Rd
- 12933 W Polo Ave
- 12352 W Atlantic Ave
- 2207 Williamsburg Dr
- 35400 N Green Bay Rd
- 3436 Florida Ave
- 3409 Glen Flora Ave
- 2008 Harding Ave
- 2009 Harding Ave
- 2713 Varonen Ave
- 12698 W Grandview Ave
- 1722 N Frolic Ave
- 1732 N Frolic Ave
- 1720 N Frolic Ave
- 1716 N Frolic Ave
- 1725 N Ashley Ln
- 1727 N Ashley Ln
- 1738 N Frolic Ave
- 1731 N Ashley Ln
- 1721 N Ashley Ln
- 1733 N Ashley Ln
- 1719 N Ashley Ln
- 1714 N Frolic Ave
- 1715 N Ashley Ln
- 1737 N Ashley Ln
- 1727 N Frolic Ave
- 1710 N Frolic Ave
- 1723 N Frolic Ave
- 1713 N Ashley Ln
- 1733 N Frolic Ave Unit 2
- 1744 N Frolic Ave