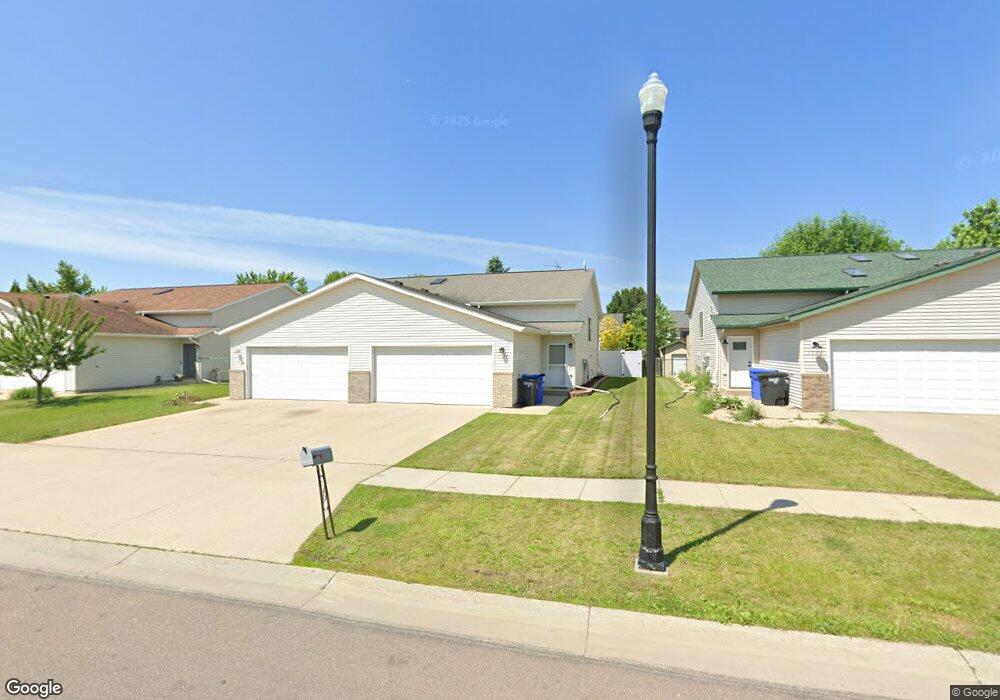
1727 49th St S Fargo, ND 58103
Willow Park NeighborhoodEstimated Value: $268,000 - $270,755
3
Beds
2
Baths
1,930
Sq Ft
$139/Sq Ft
Est. Value
About This Home
This home is located at 1727 49th St S, Fargo, ND 58103 and is currently estimated at $269,189, approximately $139 per square foot. 1727 49th St S is a home located in Cass County with nearby schools including Willow Park Elementary School, Cheney Middle School, and West Fargo High School.
Ownership History
Date
Name
Owned For
Owner Type
Purchase Details
Closed on
Nov 1, 2021
Sold by
Harbeke Brian James and Harbeke Tori
Bought by
Leverington Ryan S and Robins Tracy A
Current Estimated Value
Home Financials for this Owner
Home Financials are based on the most recent Mortgage that was taken out on this home.
Original Mortgage
$220,190
Outstanding Balance
$201,456
Interest Rate
2.88%
Mortgage Type
New Conventional
Estimated Equity
$67,733
Purchase Details
Closed on
May 21, 2012
Sold by
Charon Chad L
Bought by
Harbeke Brian James
Create a Home Valuation Report for This Property
The Home Valuation Report is an in-depth analysis detailing your home's value as well as a comparison with similar homes in the area
Home Values in the Area
Average Home Value in this Area
Purchase History
| Date | Buyer | Sale Price | Title Company |
|---|---|---|---|
| Leverington Ryan S | $227,000 | New Title Company Name | |
| Harbeke Brian James | -- | Fm Title |
Source: Public Records
Mortgage History
| Date | Status | Borrower | Loan Amount |
|---|---|---|---|
| Open | Leverington Ryan S | $220,190 |
Source: Public Records
Tax History Compared to Growth
Tax History
| Year | Tax Paid | Tax Assessment Tax Assessment Total Assessment is a certain percentage of the fair market value that is determined by local assessors to be the total taxable value of land and additions on the property. | Land | Improvement |
|---|---|---|---|---|
| 2024 | $3,175 | $119,750 | $19,450 | $100,300 |
| 2023 | $2,870 | $111,050 | $15,200 | $95,850 |
| 2022 | $2,692 | $99,150 | $15,200 | $83,950 |
| 2021 | $2,618 | $95,350 | $15,200 | $80,150 |
| 2020 | $2,457 | $90,800 | $15,200 | $75,600 |
| 2019 | $2,377 | $88,150 | $8,450 | $79,700 |
| 2018 | $2,284 | $88,150 | $8,450 | $79,700 |
| 2017 | $2,168 | $85,600 | $8,450 | $77,150 |
| 2016 | $1,970 | $83,100 | $8,450 | $74,650 |
| 2015 | $1,880 | $75,700 | $6,350 | $69,350 |
| 2014 | $1,814 | $70,100 | $6,350 | $63,750 |
| 2013 | $1,813 | $70,100 | $6,350 | $63,750 |
Source: Public Records
Map
Nearby Homes
- 1842 52nd St S
- 1970 Burlington Dr
- 1522 Baywood Dr
- 1534 Baywood Dr
- 1829 13th St E
- 1859 13th St E
- 1836 12th St E
- 1845 Huntington Ct
- 987 14th Ave E
- 1511 11th Ave E
- 4836 9th Ave S
- 4470 24th Ave S Unit 703
- 4470 24th Ave S Unit 604
- 4470 24th Ave S Unit 303
- 4470 24th Ave S Unit 606
- 4470 24th Ave S Unit 602
- 4470 24th Ave S Unit 301
- 4470 24th Ave S Unit 302
- 4470 24th Ave S Unit 502
- 4470 24th Ave S Unit 603