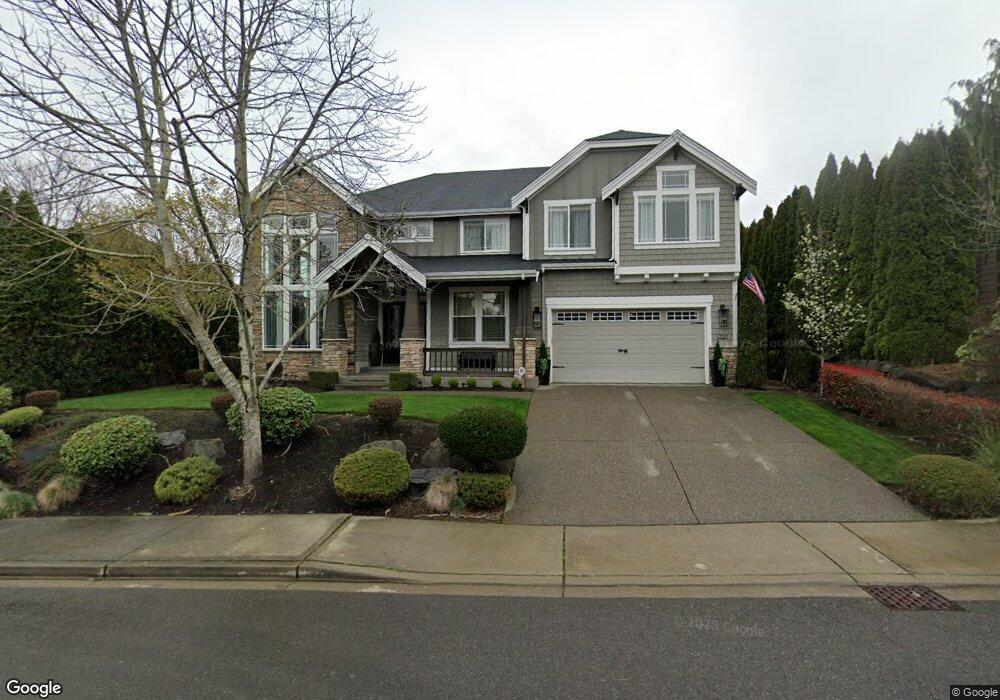
1727 69th St SE Auburn, WA 98092
Estimated Value: $1,002,178 - $1,302,000
4
Beds
3
Baths
3,709
Sq Ft
$296/Sq Ft
Est. Value
About This Home
This home is located at 1727 69th St SE, Auburn, WA 98092 and is currently estimated at $1,099,545, approximately $296 per square foot. 1727 69th St SE is a home located in Pierce County with nearby schools including Lakeland Hills Elementary School, Mt Baker Middle School, and Auburn Riverside High School.
Ownership History
Date
Name
Owned For
Owner Type
Purchase Details
Closed on
Dec 20, 2008
Sold by
Steve Jensen Ltd
Bought by
Ashby Ryan P and Ashby Shannon
Current Estimated Value
Home Financials for this Owner
Home Financials are based on the most recent Mortgage that was taken out on this home.
Original Mortgage
$593,934
Outstanding Balance
$377,581
Interest Rate
5.37%
Mortgage Type
Purchase Money Mortgage
Estimated Equity
$721,964
Create a Home Valuation Report for This Property
The Home Valuation Report is an in-depth analysis detailing your home's value as well as a comparison with similar homes in the area
Home Values in the Area
Average Home Value in this Area
Purchase History
| Date | Buyer | Sale Price | Title Company |
|---|---|---|---|
| Ashby Ryan P | $660,000 | Chicago Title Insurance Co |
Source: Public Records
Mortgage History
| Date | Status | Borrower | Loan Amount |
|---|---|---|---|
| Open | Ashby Ryan P | $593,934 |
Source: Public Records
Tax History Compared to Growth
Tax History
| Year | Tax Paid | Tax Assessment Tax Assessment Total Assessment is a certain percentage of the fair market value that is determined by local assessors to be the total taxable value of land and additions on the property. | Land | Improvement |
|---|---|---|---|---|
| 2025 | $10,311 | $1,002,900 | $290,400 | $712,500 |
| 2024 | $10,311 | $947,800 | $280,200 | $667,600 |
| 2023 | $10,311 | $913,000 | $280,200 | $632,800 |
| 2022 | $10,229 | $962,700 | $272,600 | $690,100 |
| 2021 | $9,871 | $740,100 | $192,300 | $547,800 |
| 2019 | $8,112 | $687,200 | $169,600 | $517,600 |
| 2018 | $9,452 | $676,300 | $172,000 | $504,300 |
| 2017 | $9,134 | $626,200 | $144,600 | $481,600 |
| 2016 | $7,640 | $544,500 | $102,600 | $441,900 |
| 2014 | $6,897 | $515,000 | $91,100 | $423,900 |
| 2013 | $6,897 | $457,800 | $75,900 | $381,900 |
Source: Public Records
Map
Nearby Homes
- 6726 Rebecca Ct SE
- 6715 Quincy Ave SE
- 1825 67th St SE
- 1827 66th St SE
- 6672 Udall Place SE
- 2168 69th St SE
- 6547 Lindsay Ave SE Unit 18C
- 1402 63rd Ct SE
- 1914 62nd St SE
- 1618 73rd St SE Unit 16
- 6313 Victoria Ave SE
- 6109 Perry Ave SE
- 6331 Isaac Ave SE Unit E
- 6409 Hazel Ln SE Unit H
- 2101 62nd St SE
- 1105 63rd St SE Unit C
- 1605 61st St SE
- 6626 Francis Ave SE
- 6499 Francis Loop SE Unit 80
- 6129 Lindsay Dr SE Unit C8
- 1717 69th St SE
- 1805 69th St SE
- 6725 Rebecca Ct SE
- 1802 69th St SE
- 1722 69th St SE
- 1711 69th St SE
- 6717 Rebecca Ct SE
- 6802 Quincy Ave SE
- 1812 69th St SE
- 6718 Rebecca Ct SE
- 1714 69th St SE
- 6720 Quincy Ave SE
- 1825 69th St SE
- 6711 Rebecca Ct SE
- 1818 69th St SE
- 6725 Stuart Ave SE
- 6712 Rebecca Ct SE
- 6712 Quincy Ave SE
- 6811 Quincy Ave SE
