1727 High Noon Rd Bellingham, WA 98226
Estimated Value: $500,000 - $1,022,000
2
Beds
2
Baths
1,658
Sq Ft
$410/Sq Ft
Est. Value
About This Home
This home is located at 1727 High Noon Rd, Bellingham, WA 98226 and is currently estimated at $679,865, approximately $410 per square foot. 1727 High Noon Rd is a home located in Whatcom County with nearby schools including Mount Baker Senior High School.
Ownership History
Date
Name
Owned For
Owner Type
Purchase Details
Closed on
Mar 10, 2014
Sold by
Shea Cianat Dixon
Bought by
Dunavan Caryl Louise
Current Estimated Value
Purchase Details
Closed on
Dec 28, 2009
Sold by
Kildall Frederick W and Dunavan Caryl Louise
Bought by
Shea Cianat D
Purchase Details
Closed on
Mar 18, 2004
Sold by
Kildall Frederick W and Dunavan Caryl Louisa
Bought by
Shea Cianat D
Create a Home Valuation Report for This Property
The Home Valuation Report is an in-depth analysis detailing your home's value as well as a comparison with similar homes in the area
Home Values in the Area
Average Home Value in this Area
Purchase History
| Date | Buyer | Sale Price | Title Company |
|---|---|---|---|
| Dunavan Caryl Louise | -- | None Available | |
| Shea Cianat D | -- | None Available | |
| Shea Cianat D | -- | -- |
Source: Public Records
Tax History Compared to Growth
Tax History
| Year | Tax Paid | Tax Assessment Tax Assessment Total Assessment is a certain percentage of the fair market value that is determined by local assessors to be the total taxable value of land and additions on the property. | Land | Improvement |
|---|---|---|---|---|
| 2024 | $4,607 | $578,343 | $287,795 | $290,548 |
| 2023 | $4,607 | $634,281 | $362,509 | $271,772 |
| 2022 | $4,033 | $519,892 | $297,132 | $222,760 |
| 2021 | $2,951 | $419,262 | $239,620 | $179,642 |
| 2020 | $2,717 | $287,148 | $203,067 | $84,081 |
| 2019 | $2,428 | $252,999 | $178,917 | $74,082 |
| 2018 | $2,677 | $243,924 | $172,500 | $71,424 |
| 2017 | $2,423 | $210,529 | $129,024 | $81,505 |
| 2016 | $2,332 | $203,220 | $124,544 | $78,676 |
| 2015 | $2,151 | $194,081 | $118,944 | $75,137 |
| 2014 | -- | $182,751 | $112,000 | $70,751 |
| 2013 | -- | $182,751 | $112,000 | $70,751 |
Source: Public Records
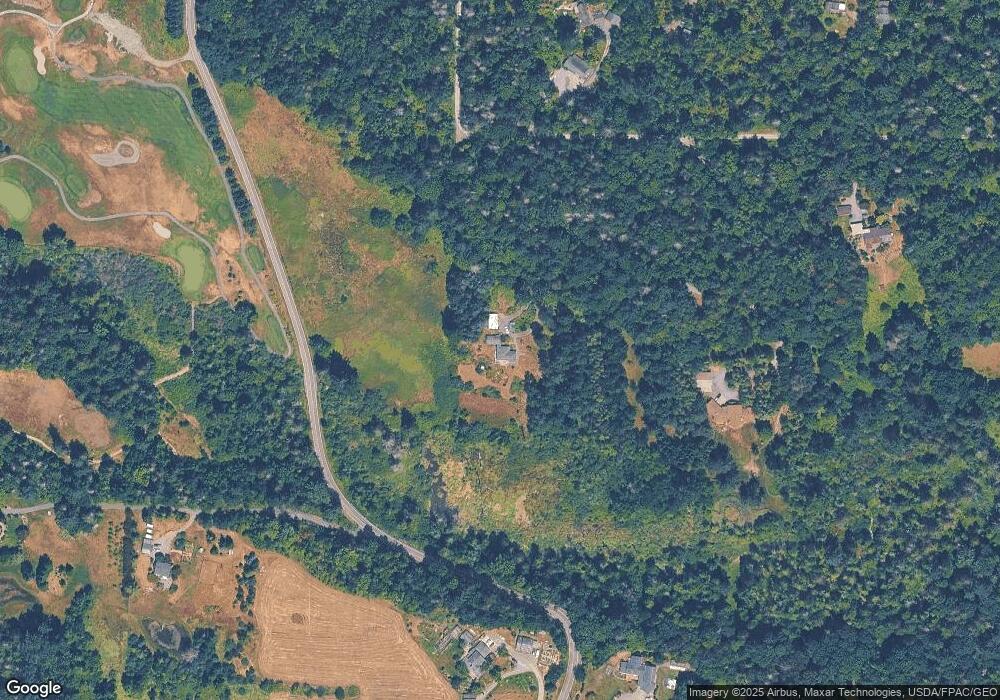
Map
Nearby Homes
- 5539 Noon Rd
- 5975 Hoag Ln
- 1891 E Smith Rd
- 5818 Everson Goshen Rd
- 2571 E Smith Rd
- 2200 E Smith Rd
- 1321 E Smith Rd
- 5180 Penny Ln
- 1383 Ten Mile Rd
- 6068 E Hemmi Ln
- 1817 Central Rd
- 0 xxxx Kelly Rd
- 2403 E Hemmi Rd
- 2529 E Hemmi Rd
- 5750 Denali Ln
- 5720 Denali Ln
- 858 E Smith Rd
- 5707 Denali Ln
- 739 Denali Ct
- 740 Denali Ct