1727 Hunter Rd Elberton, GA 30635
Estimated Value: $463,000 - $572,000
3
Beds
2
Baths
2,620
Sq Ft
$194/Sq Ft
Est. Value
About This Home
This home is located at 1727 Hunter Rd, Elberton, GA 30635 and is currently estimated at $507,812, approximately $193 per square foot. 1727 Hunter Rd is a home located in Elbert County with nearby schools including Elbert County Primary School, Elbert County Elementary School, and Elbert County Middle School.
Ownership History
Date
Name
Owned For
Owner Type
Purchase Details
Closed on
Feb 25, 2021
Sold by
Holbrook Donald E
Bought by
Westbrooks Ruth and Westbrooks John L
Current Estimated Value
Home Financials for this Owner
Home Financials are based on the most recent Mortgage that was taken out on this home.
Original Mortgage
$312,000
Outstanding Balance
$279,686
Interest Rate
2.7%
Mortgage Type
New Conventional
Estimated Equity
$228,126
Purchase Details
Closed on
Jun 4, 2019
Sold by
Schlobohm Ernest Jerome
Bought by
Holbrook Donald E and Holbrook Rita J
Purchase Details
Closed on
Apr 20, 2017
Sold by
Davis Joey
Bought by
Schlobohm Ernest Jerome and Schiobohm Megan Elizabeth
Purchase Details
Closed on
Sep 30, 2011
Sold by
Wallace James A
Bought by
Davis Joey and Davis Heidi
Purchase Details
Closed on
Nov 9, 1999
Sold by
Daniel G Parker
Bought by
Wright Clarence E
Purchase Details
Closed on
Oct 1, 1990
Purchase Details
Closed on
Jan 1, 1952
Create a Home Valuation Report for This Property
The Home Valuation Report is an in-depth analysis detailing your home's value as well as a comparison with similar homes in the area
Home Values in the Area
Average Home Value in this Area
Purchase History
| Date | Buyer | Sale Price | Title Company |
|---|---|---|---|
| Westbrooks Ruth | $390,000 | -- | |
| Holbrook Donald E | $315,000 | -- | |
| Schlobohm Ernest Jerome | $265,000 | -- | |
| Davis Joey | $270,000 | -- | |
| Wright Clarence E | $95,000 | -- | |
| -- | -- | -- | |
| -- | $4,400 | -- |
Source: Public Records
Mortgage History
| Date | Status | Borrower | Loan Amount |
|---|---|---|---|
| Open | Westbrooks Ruth | $312,000 |
Source: Public Records
Tax History Compared to Growth
Tax History
| Year | Tax Paid | Tax Assessment Tax Assessment Total Assessment is a certain percentage of the fair market value that is determined by local assessors to be the total taxable value of land and additions on the property. | Land | Improvement |
|---|---|---|---|---|
| 2024 | $4,446 | $195,413 | $9,259 | $186,154 |
| 2023 | $4,446 | $195,413 | $9,259 | $186,154 |
| 2022 | $3,518 | $155,958 | $5,512 | $150,446 |
| 2021 | $3,505 | $155,958 | $5,512 | $150,446 |
| 2020 | $3,004 | $133,696 | $4,409 | $129,287 |
| 2019 | $3,775 | $133,696 | $4,409 | $129,287 |
| 2018 | $2,927 | $133,696 | $4,409 | $129,287 |
| 2017 | $3,496 | $113,264 | $4,409 | $108,855 |
| 2016 | $3,266 | $113,264 | $4,409 | $108,855 |
| 2015 | -- | $113,264 | $4,409 | $108,855 |
| 2014 | -- | $113,264 | $4,409 | $108,855 |
| 2013 | -- | $113,264 | $4,409 | $108,855 |
Source: Public Records
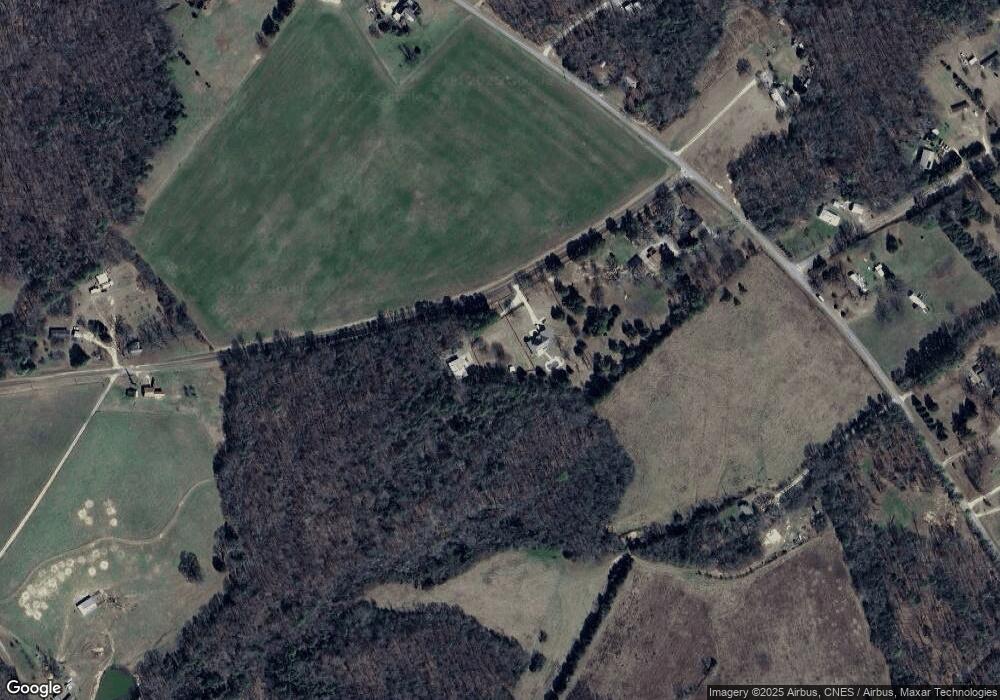
Map
Nearby Homes
- 2946 Rock Branch Rd
- 0 Moore Rd Unit 10552577
- 3113 Press Mann Rd
- 0 Jacks Hat Rd Unit 10614621
- 0 Jacks Hat Rd Unit 24288811
- 0 Jacks Hat Rd Unit 10597905
- 0 Jacks Hat Rd Unit 7657227
- 0 Anderson Hwy Unit 24629664
- 0 Anderson Hwy Unit 10536298
- 0 Hornets Bridge Rd Unit 10523059
- 0 Hornets Bridge Rd Unit 10523061
- 0 Hornets Bridge Rd Unit 10601215
- 0 Hornets Bridge Rd Unit 2 10295928
- 1049 Jaybird Rd
- 0 Gregg Shoals Dr Unit 10497348
- 0 Gregg Shoals Dr Unit CL342115
- 0 Gregg Shoals Dr Unit LotWP001 24031325
- 00 Hornets Bridge Rd
- 2187 Turner Hill Rd
- 0 Millstone Creek Rd Unit 10531895
- 3129 Rock Branch Rd
- 3099 Rock Branch Rd
- 3154 Rock Branch Rd
- 3122 Rock Branch Rd
- 3138 Rock Branch Rd
- 3181 Rock Branch Rd
- 3164 Rock Branch Rd
- 1725 Jerry Ln
- 3100 Rock Branch Rd
- 1673 Hunter Rd
- 1672 Hunter Rd
- 0000000 Rock Branch Rd
- 0 Rock Branch Rd Unit 7316707
- 0 Rock Branch Rd Unit 8814293
- 0 Rock Branch Rd Unit 8811797
- 0 Rock Branch Rd Unit 8687081
- 0 Rock Branch Rd Unit 7116206
- 0 Rock Branch Rd
- 1720 Jerry Ln
- 3178 Rock Branch Rd