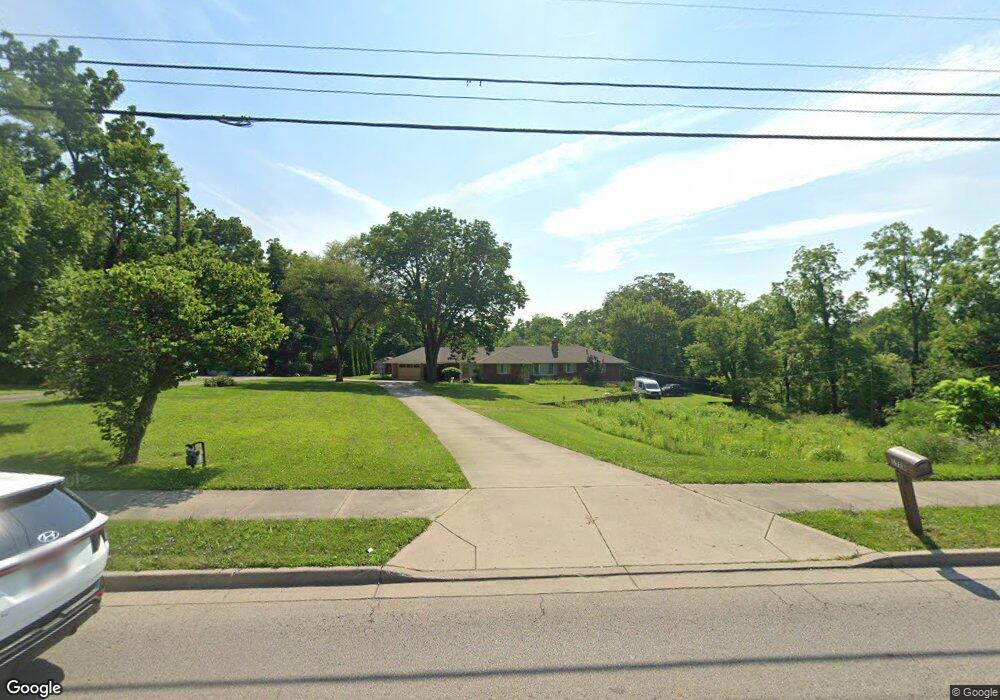
1728 Dixie Dr S Dayton, OH 45414
Estimated Value: $301,000 - $386,172
4
Beds
3
Baths
2,312
Sq Ft
$141/Sq Ft
Est. Value
About This Home
This home is located at 1728 Dixie Dr S, Dayton, OH 45414 and is currently estimated at $327,043, approximately $141 per square foot. 1728 Dixie Dr S is a home located in Montgomery County with nearby schools including Demmitt Elementary School, Smith Middle School, and Butler High School.
Ownership History
Date
Name
Owned For
Owner Type
Purchase Details
Closed on
Mar 14, 2012
Sold by
Federal Home Loan Mortgage Corporation
Bought by
Gad Keith A
Current Estimated Value
Home Financials for this Owner
Home Financials are based on the most recent Mortgage that was taken out on this home.
Original Mortgage
$50,000
Interest Rate
3.9%
Mortgage Type
FHA
Purchase Details
Closed on
Nov 22, 2011
Sold by
Winterbotham Baker Joyce A and Baker Jack A
Bought by
Federal Home Loan Mortgage Corp
Purchase Details
Closed on
Aug 12, 2008
Sold by
Relocation Advantage Llc
Bought by
Baker Jack A and Winterbetham Baker Joyce A
Purchase Details
Closed on
Aug 11, 2008
Sold by
Johnson Charles C and Johnson Donna M
Bought by
Relocation Advantage Llc
Purchase Details
Closed on
Jun 30, 2006
Sold by
Johnson Charles
Bought by
City Of Vandalia
Create a Home Valuation Report for This Property
The Home Valuation Report is an in-depth analysis detailing your home's value as well as a comparison with similar homes in the area
Home Values in the Area
Average Home Value in this Area
Purchase History
| Date | Buyer | Sale Price | Title Company |
|---|---|---|---|
| Gad Keith A | $131,000 | Intitle Agency Inc | |
| Federal Home Loan Mortgage Corp | $92,000 | None Available | |
| Baker Jack A | $229,000 | None Available | |
| Relocation Advantage Llc | $229,000 | None Available | |
| City Of Vandalia | -- | None Available |
Source: Public Records
Mortgage History
| Date | Status | Borrower | Loan Amount |
|---|---|---|---|
| Previous Owner | Gad Keith A | $50,000 |
Source: Public Records
Tax History Compared to Growth
Tax History
| Year | Tax Paid | Tax Assessment Tax Assessment Total Assessment is a certain percentage of the fair market value that is determined by local assessors to be the total taxable value of land and additions on the property. | Land | Improvement |
|---|---|---|---|---|
| 2024 | $5,678 | $108,300 | $54,660 | $53,640 |
| 2023 | $5,678 | $108,300 | $54,660 | $53,640 |
| 2022 | $5,200 | $80,220 | $40,480 | $39,740 |
| 2021 | $5,205 | $80,220 | $40,480 | $39,740 |
| 2020 | $5,190 | $80,220 | $40,480 | $39,740 |
| 2019 | $5,658 | $80,210 | $40,480 | $39,730 |
| 2018 | $5,669 | $80,210 | $40,480 | $39,730 |
| 2017 | $5,606 | $80,210 | $40,480 | $39,730 |
| 2016 | $5,485 | $77,090 | $40,480 | $36,610 |
Source: Public Records
Map
Nearby Homes
- 1441 S Dixie Dr
- 416 Bent Twig Dr
- 469 Farrell Rd
- 1515 Ash Ridge Ct
- 3518 Park Crest Ln
- 246 Crest Hill Ave
- 770 Deer Creek Dr
- 461 Poplar Grove Dr
- 1052 Forest Crest Place
- 917 Howard Ln
- 3600 Little York Rd
- 1588 Middle Park Dr
- 1054 Wilhelmina Dr
- 847 Waldsmith Way
- 668 Deerhurst Dr
- 678 Deerhurst Dr
- Fairfax Plan at Foxfire - Maple Street Collection
- Yosemite Plan at Foxfire - Maple Street Collection
- Cumberland Plan at Foxfire - Maple Street Collection
- Jensen Plan at Foxfire - Maple Street Collection
- 1728 S Dixie Dr
- 1692 S Dixie Dr
- 9475 N Dixie Dr
- 1660 Dunsinane Ct
- 1625 Dunsinane Ct
- 9475 N Dixie Dr
- 9445 N Dixie Dr
- 1640 Dunsinane Ct
- 9435 N Dixie Dr
- 92 Garret St Unit 4
- 1605 Dunsinane Ct
- 1636 S Dixie Dr
- 210 Timberwind Ln
- 150 Timberwind Ln
- 1596 Aberdeen Ct
- 220 Timberwind Ln
- 17 Paddock View Ct
- 19 Paddock View Ct Unit 19
- 19 Paddock View Ct
- 1585 Aberdeen Ct