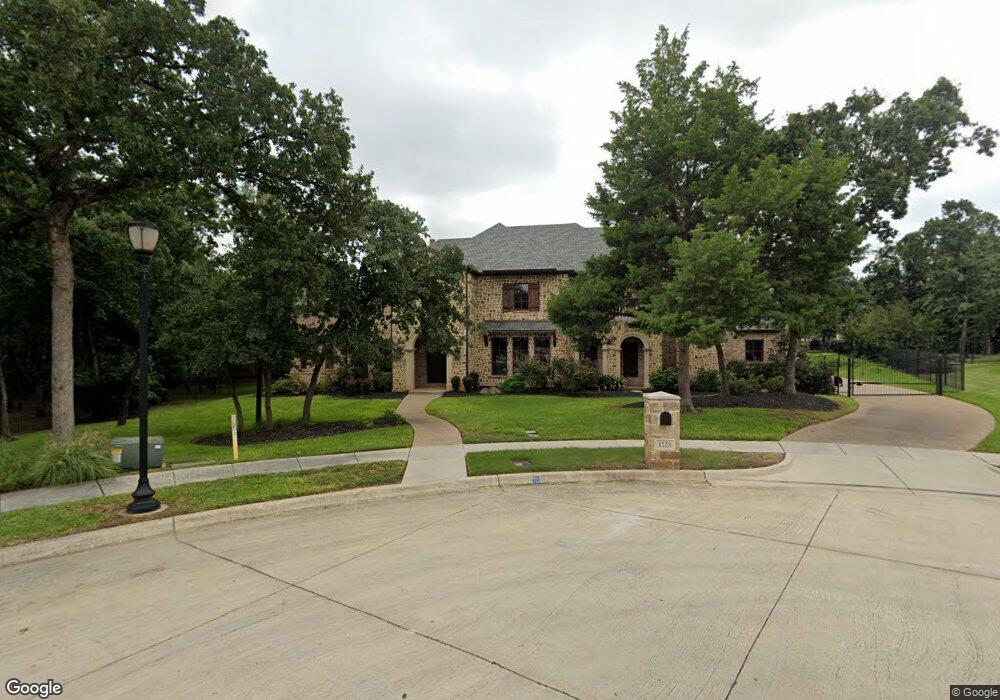
1728 Grass Ct Southlake, TX 76092
Estimated Value: $2,344,000 - $2,946,003
5
Beds
5
Baths
5,429
Sq Ft
$479/Sq Ft
Est. Value
About This Home
This home is located at 1728 Grass Ct, Southlake, TX 76092 and is currently estimated at $2,599,334, approximately $478 per square foot. 1728 Grass Ct is a home with nearby schools including Jack D. Johnson Elementary, Don T. Durham Intermediate School, and Carroll Middle School.
Ownership History
Date
Name
Owned For
Owner Type
Purchase Details
Closed on
Oct 11, 2012
Sold by
Main And Main Development Ltd
Bought by
Petersen Jeffrey and Dobbs Petersen April
Current Estimated Value
Home Financials for this Owner
Home Financials are based on the most recent Mortgage that was taken out on this home.
Original Mortgage
$255,000
Interest Rate
3.61%
Mortgage Type
Purchase Money Mortgage
Create a Home Valuation Report for This Property
The Home Valuation Report is an in-depth analysis detailing your home's value as well as a comparison with similar homes in the area
Home Values in the Area
Average Home Value in this Area
Purchase History
| Date | Buyer | Sale Price | Title Company |
|---|---|---|---|
| Petersen Jeffrey | -- | None Available |
Source: Public Records
Mortgage History
| Date | Status | Borrower | Loan Amount |
|---|---|---|---|
| Closed | Petersen Jeffrey | $255,000 |
Source: Public Records
Tax History Compared to Growth
Tax History
| Year | Tax Paid | Tax Assessment Tax Assessment Total Assessment is a certain percentage of the fair market value that is determined by local assessors to be the total taxable value of land and additions on the property. | Land | Improvement |
|---|---|---|---|---|
| 2025 | $27,900 | $1,956,912 | $525,090 | $1,431,822 |
| 2024 | $27,900 | $2,200,000 | $525,090 | $1,674,910 |
| 2023 | $29,651 | $2,091,356 | $525,090 | $1,566,266 |
| 2022 | $31,906 | $1,682,900 | $375,075 | $1,307,825 |
| 2021 | $30,654 | $1,344,455 | $375,075 | $969,380 |
| 2020 | $31,087 | $1,352,454 | $450,060 | $902,394 |
| 2019 | $35,488 | $1,465,522 | $350,000 | $1,115,522 |
| 2018 | $32,740 | $1,418,668 | $350,000 | $1,068,668 |
| 2017 | $31,967 | $1,289,698 | $325,000 | $964,698 |
| 2016 | $31,081 | $1,253,941 | $325,000 | $928,941 |
| 2015 | $22,909 | $1,315,000 | $300,000 | $1,015,000 |
| 2014 | $22,909 | $915,100 | $300,000 | $615,100 |
Source: Public Records
Map
Nearby Homes
- 1287 N Sunshine Ln
- 1459 Sunshine Ln
- 1469 Sunshine Ln
- 2080 E Dove Rd Unit Lot 4
- 2080 E Dove Rd Unit Lots 1, 2, 4, 5, 6
- 2080 E Dove Rd Unit Lot 2
- 2080 E (Lot 1) Dove Rd
- 2080 E Dove Rd Unit Lot 6
- 1621 Carruth Ln
- 2040 E Dove Rd
- 1963 E Dove Rd
- 1480 N Kimball Ave
- 2947 Kosse Ct
- 2941 Kosse Ct
- Walker Plan at Dove Station
- Florence Plan at Dove Station
- Jade Plan at Dove Station
- 1700 Live Oak Ln
- 2002 Harwell St
- 2023 Harwell St
- 1729 Grass Ct
- 1724 Grass Ct
- 1209 Andre Ct
- 1721 Grass Ct
- 1208 Andre Ct
- 1240 Stanhope Ct
- 1230 Stanhope Ct
- 1720 Grass Ct
- 1220 Stanhope Ct
- 1205 Andre Ct
- 1709 Grass Ct
- 1204 Andre Ct
- 1311 Sunshine Ln
- 1297 Sunshine Ln
- 1705 Grass Ct
- 1210 Stanhope Ct
- 1716 Grass Ct
- 1245 Stanhope Ct
- 1235 Stanhope Ct
- 1780 E Highland St