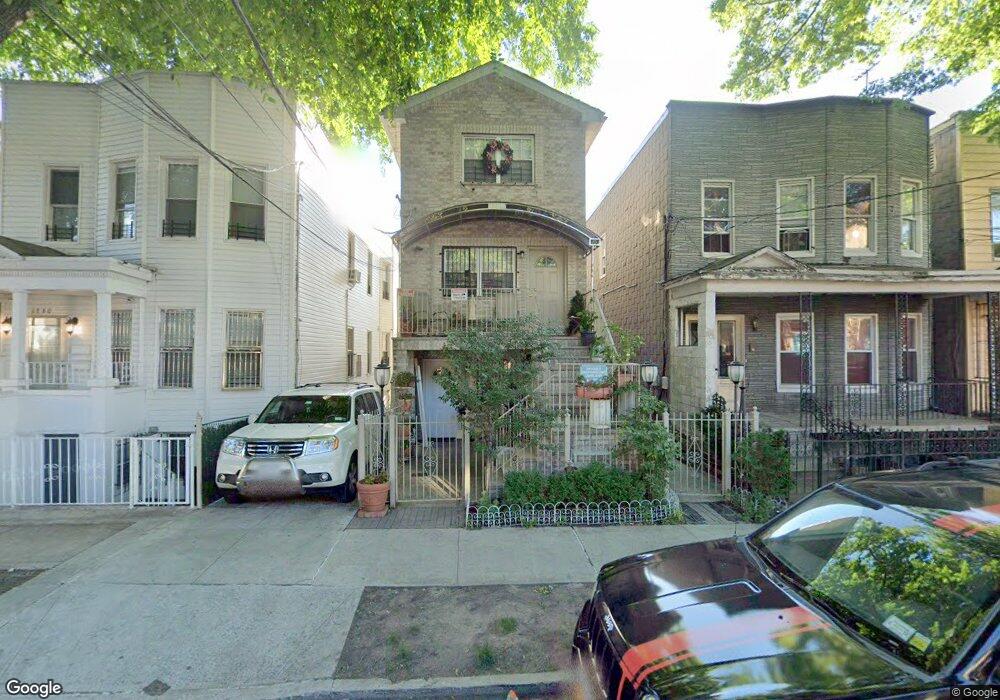
1728 Melville St Bronx, NY 10460
Van Nest NeighborhoodEstimated Value: $844,000 - $1,052,000
Studio
--
Bath
2,441
Sq Ft
$382/Sq Ft
Est. Value
About This Home
This home is located at 1728 Melville St, Bronx, NY 10460 and is currently estimated at $931,463, approximately $381 per square foot. 1728 Melville St is a home located in Bronx County with nearby schools including P.S. 105 Senator Abraham Bernstein, Pelham Academy, and Bronx Green Middle School.
Ownership History
Date
Name
Owned For
Owner Type
Purchase Details
Closed on
Jun 29, 2011
Sold by
Lumaj Flores
Bought by
Flores Elizabeth and Flores Miguel
Current Estimated Value
Home Financials for this Owner
Home Financials are based on the most recent Mortgage that was taken out on this home.
Original Mortgage
$433,593
Outstanding Balance
$298,440
Interest Rate
4.52%
Mortgage Type
Purchase Money Mortgage
Estimated Equity
$633,023
Purchase Details
Closed on
May 16, 2007
Sold by
Rios Amada
Bought by
Lumaj Fanda
Home Financials for this Owner
Home Financials are based on the most recent Mortgage that was taken out on this home.
Original Mortgage
$436,497
Interest Rate
6.24%
Mortgage Type
Purchase Money Mortgage
Purchase Details
Closed on
Jun 14, 1995
Sold by
Cavilla Ann
Bought by
Glenn Madeline
Home Financials for this Owner
Home Financials are based on the most recent Mortgage that was taken out on this home.
Original Mortgage
$161,500
Interest Rate
7.61%
Create a Home Valuation Report for This Property
The Home Valuation Report is an in-depth analysis detailing your home's value as well as a comparison with similar homes in the area
Home Values in the Area
Average Home Value in this Area
Purchase History
| Date | Buyer | Sale Price | Title Company |
|---|---|---|---|
| Flores Elizabeth | $477,000 | -- | |
| Lumaj Fanda | $130,000 | -- | |
| Glenn Madeline | $170,000 | Ticor Title Guarantee Compan |
Source: Public Records
Mortgage History
| Date | Status | Borrower | Loan Amount |
|---|---|---|---|
| Open | Flores Elizabeth | $433,593 | |
| Previous Owner | Lumaj Fanda | $436,497 | |
| Previous Owner | Glenn Madeline | $161,500 |
Source: Public Records
Tax History
| Year | Tax Paid | Tax Assessment Tax Assessment Total Assessment is a certain percentage of the fair market value that is determined by local assessors to be the total taxable value of land and additions on the property. | Land | Improvement |
|---|---|---|---|---|
| 2025 | $8,156 | $43,044 | $7,255 | $35,789 |
| 2024 | $8,156 | $40,608 | $7,633 | $32,975 |
| 2023 | $8,194 | $40,349 | $6,762 | $33,587 |
| 2022 | $8,038 | $51,000 | $9,000 | $42,000 |
| 2021 | $8,002 | $44,700 | $9,000 | $35,700 |
| 2020 | $7,593 | $43,020 | $9,000 | $34,020 |
| 2019 | $7,079 | $39,480 | $9,000 | $30,480 |
| 2018 | $6,854 | $33,624 | $7,505 | $26,119 |
| 2017 | $6,840 | $33,552 | $7,049 | $26,503 |
| 2016 | $6,334 | $31,685 | $7,869 | $23,816 |
| 2015 | $3,818 | $29,892 | $9,296 | $20,596 |
| 2014 | $3,818 | $28,200 | $10,020 | $18,180 |
Source: Public Records
Map
Nearby Homes
- 1713 Taylor Ave
- 591 van Nest Ave
- 1727 Van Buren St
- 588 van Nest Ave
- 518 Morris Park Ave
- 506 van Nest Ave
- 504 van Nest Ave
- 508 van Nest Ave
- 500 van Nest Ave
- 1620 Taylor Ave
- 1639 Garfield St
- 1601 Van Buren St
- 623 Baker Ave
- 1679 Unionport Rd
- 1727 Victor St
- 679 van Nest Ave
- 1721 White Plains Rd
- 1823 Amethyst St
- 1731 White Plains Rd
- 1827 Amethyst St
- 1726 Melville St
- 1730 Melville St
- 1722 Melville St
- 1732 Melville St
- 1720 Melville St
- 1736 Melville St
- 1729 Taylor Ave
- 1727 Taylor Ave
- 1731 Taylor Ave
- 1738 Melville St
- 1718 Melville St Unit 1
- 1718 Melville St
- 1725 Taylor Ave
- 1733 Taylor Ave
- 1737 Taylor Ave
- 1723 Taylor Ave
- 1740 Melville St
- 1716 Melville St
- 1721 Taylor Ave
- 1739 Taylor Ave
Your Personal Tour Guide
Ask me questions while you tour the home.