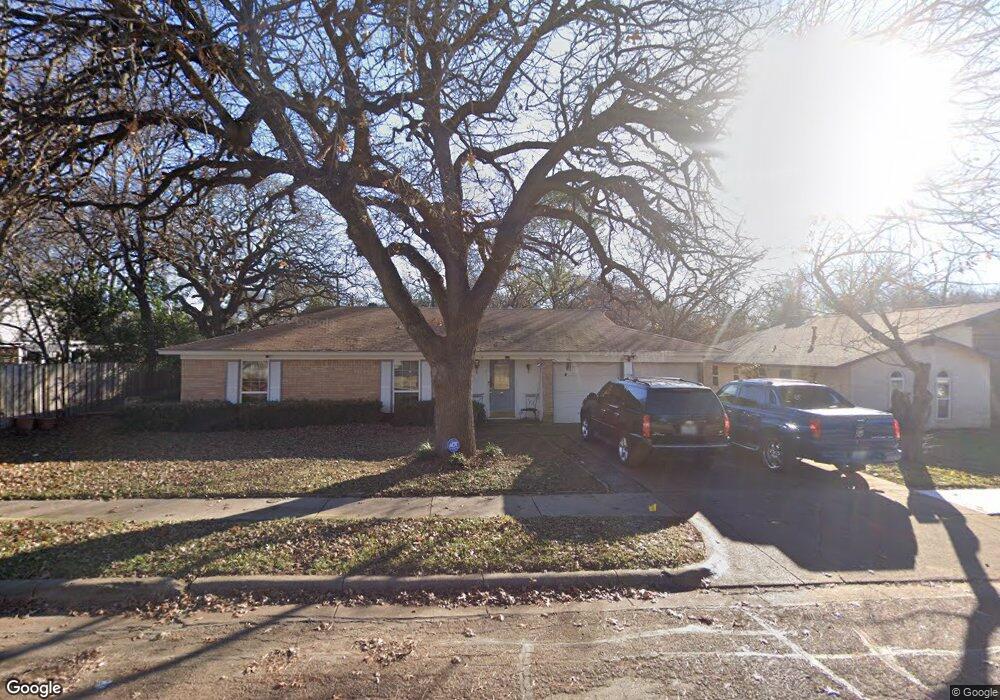
1728 Richmond Dr Bedford, TX 76022
Estimated Value: $292,000 - $326,000
3
Beds
2
Baths
1,398
Sq Ft
$221/Sq Ft
Est. Value
About This Home
This home is located at 1728 Richmond Dr, Bedford, TX 76022 and is currently estimated at $308,707, approximately $220 per square foot. 1728 Richmond Dr is a home located in Tarrant County with nearby schools including Bell Manor Elementary School, Central J High School, and Trinity High School.
Ownership History
Date
Name
Owned For
Owner Type
Purchase Details
Closed on
Jan 12, 2005
Sold by
Lino Soane F and Lino Halakiumata P
Bought by
Finau Frank
Current Estimated Value
Home Financials for this Owner
Home Financials are based on the most recent Mortgage that was taken out on this home.
Original Mortgage
$98,000
Outstanding Balance
$50,943
Interest Rate
6.2%
Mortgage Type
Purchase Money Mortgage
Estimated Equity
$257,764
Purchase Details
Closed on
Jun 15, 1998
Sold by
Camelot Homes Inc
Bought by
Lino Soane F and Lino Halakiumata P
Home Financials for this Owner
Home Financials are based on the most recent Mortgage that was taken out on this home.
Original Mortgage
$84,816
Interest Rate
7.17%
Mortgage Type
FHA
Purchase Details
Closed on
Feb 3, 1998
Sold by
Gonzales Martin A
Bought by
Camelot Homes Inc
Create a Home Valuation Report for This Property
The Home Valuation Report is an in-depth analysis detailing your home's value as well as a comparison with similar homes in the area
Home Values in the Area
Average Home Value in this Area
Purchase History
| Date | Buyer | Sale Price | Title Company |
|---|---|---|---|
| Finau Frank | -- | First Land Title | |
| Lino Soane F | -- | Old Republic Title | |
| Camelot Homes Inc | $61,045 | -- |
Source: Public Records
Mortgage History
| Date | Status | Borrower | Loan Amount |
|---|---|---|---|
| Open | Finau Frank | $98,000 | |
| Previous Owner | Lino Soane F | $84,816 | |
| Closed | Finau Frank | $24,500 |
Source: Public Records
Tax History Compared to Growth
Tax History
| Year | Tax Paid | Tax Assessment Tax Assessment Total Assessment is a certain percentage of the fair market value that is determined by local assessors to be the total taxable value of land and additions on the property. | Land | Improvement |
|---|---|---|---|---|
| 2025 | $4,149 | $213,095 | $65,000 | $148,095 |
| 2024 | $4,149 | $213,095 | $65,000 | $148,095 |
| 2023 | $3,732 | $194,590 | $45,000 | $149,590 |
| 2022 | $4,076 | $186,604 | $45,000 | $141,604 |
| 2021 | $3,818 | $162,081 | $45,000 | $117,081 |
| 2020 | $4,434 | $186,503 | $45,000 | $141,503 |
| 2019 | $4,562 | $187,789 | $45,000 | $142,789 |
| 2018 | $3,808 | $156,745 | $23,000 | $133,745 |
| 2017 | $3,445 | $142,422 | $23,000 | $119,422 |
| 2016 | $3,103 | $128,289 | $23,000 | $105,289 |
| 2015 | $2,685 | $106,900 | $18,000 | $88,900 |
| 2014 | $2,685 | $106,900 | $18,000 | $88,900 |
Source: Public Records
Map
Nearby Homes
- 1604 Richmond Dr
- 1613 Trinity Ct
- 933 Charleston Ct
- 804 Natchez Ave
- 952 Charleston Dr
- 2024 Charleston Dr
- 2101 Gettysburg Place
- 1701 Winchester Way
- 904 Nelson Terrace
- 1031 Boston Blvd
- 828 Gregory Ave
- 808 Gregory Ave
- 800 Prestwick St
- 1216 Princeton Place
- 909 Overhill Dr
- 2025 Schumac Ln
- 921 Overhill Dr
- 2201 Greendale Ct
- 1004 Overhill Dr
- 1049 Stableway Ln
- 1724 Richmond Dr
- 817 Charleston Dr
- 813 Charleston Dr
- 1720 Richmond Dr
- 900 Chattanooga Dr
- 809 Charleston Dr
- 901 Charleston Dr
- 901 Chattanooga Dr
- 1616 Richmond Dr
- 1621 Pipeline Rd E
- 904 Chattanooga Dr
- 816 Charleston Dr
- 820 Charleston Dr
- 805 Charleston Dr
- 905 Chattanooga Dr
- 812 Charleston Dr
- 900 Charleston Dr
- 900 Shell Ct
- 1612 Richmond Dr
- 905 Charleston Dr