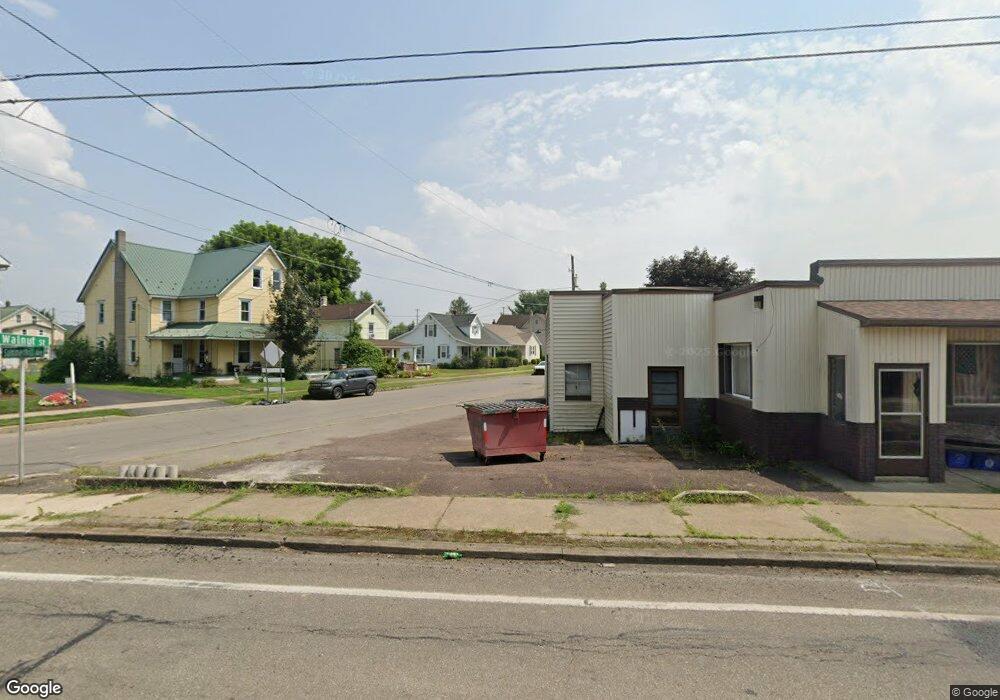
1728 Walnut St Berwick, PA 18603
Estimated Value: $188,000 - $243,000
3
Beds
2
Baths
2,070
Sq Ft
$99/Sq Ft
Est. Value
About This Home
This home is located at 1728 Walnut St, Berwick, PA 18603 and is currently estimated at $204,699, approximately $98 per square foot. 1728 Walnut St is a home located in Columbia County with nearby schools including Berwick Area High School, Holy Family Consolidated School, and New Story School.
Ownership History
Date
Name
Owned For
Owner Type
Purchase Details
Closed on
Dec 15, 2017
Sold by
Shutz Scott K and Shutz Joyce A
Bought by
Mclaughlin Adrianne M
Current Estimated Value
Home Financials for this Owner
Home Financials are based on the most recent Mortgage that was taken out on this home.
Original Mortgage
$134,100
Outstanding Balance
$112,784
Interest Rate
3.9%
Mortgage Type
New Conventional
Estimated Equity
$91,915
Purchase Details
Closed on
Jul 11, 2016
Sold by
Nationstar Mortgage Llc
Bought by
Schultz Scott
Purchase Details
Closed on
Jun 10, 2016
Sold by
Tanribiler Kevin and Estate Of Louis Deluca
Bought by
Nationstar Mortgage Llc and Champion Mortgage Company
Purchase Details
Closed on
Oct 29, 2010
Sold by
Deluca Louis and Estate Of Doris Kierstead
Bought by
Deluca Louis
Create a Home Valuation Report for This Property
The Home Valuation Report is an in-depth analysis detailing your home's value as well as a comparison with similar homes in the area
Home Values in the Area
Average Home Value in this Area
Purchase History
| Date | Buyer | Sale Price | Title Company |
|---|---|---|---|
| Mclaughlin Adrianne M | $149,000 | None Available | |
| Schultz Scott | $41,000 | Mail Land Title Services | |
| Nationstar Mortgage Llc | $5,503 | None Available | |
| Deluca Louis | -- | None Available |
Source: Public Records
Mortgage History
| Date | Status | Borrower | Loan Amount |
|---|---|---|---|
| Open | Mclaughlin Adrianne M | $134,100 |
Source: Public Records
Tax History Compared to Growth
Tax History
| Year | Tax Paid | Tax Assessment Tax Assessment Total Assessment is a certain percentage of the fair market value that is determined by local assessors to be the total taxable value of land and additions on the property. | Land | Improvement |
|---|---|---|---|---|
| 2025 | $2,096 | $23,380 | $0 | $0 |
| 2024 | $2,073 | $23,380 | $3,000 | $20,380 |
| 2023 | $1,932 | $23,380 | $3,000 | $20,380 |
| 2022 | $1,869 | $23,380 | $3,000 | $20,380 |
| 2021 | $1,827 | $23,380 | $3,000 | $20,380 |
| 2020 | $1,786 | $23,380 | $3,000 | $20,380 |
| 2019 | $1,758 | $23,380 | $3,000 | $20,380 |
| 2018 | $1,688 | $23,380 | $3,000 | $20,380 |
| 2017 | $1,694 | $23,380 | $3,000 | $20,380 |
| 2016 | -- | $21,934 | $3,000 | $18,934 |
| 2015 | -- | $21,934 | $3,000 | $18,934 |
| 2014 | -- | $21,934 | $3,000 | $18,934 |
Source: Public Records
Map
Nearby Homes
- 1722 Walnut St
- 1732 Walnut St
- 1736 Walnut St
- 1718 Walnut St
- 17381740 Walnut St
- 1714 Walnut St
- 1729 Lincoln Ave
- 1725 Lincoln Ave
- 1725 Walnut St
- 1721 Lincoln Ave
- 1721 Walnut St
- 330 Summerhill Ave
- 1744 Walnut St
- 1704 Walnut St
- 1713 Walnut St
- 17391741 Lincoln Ave
- 326 Summerhill Ave
- 1747 Lincoln Ave
- 324 Summerhill Ave
- 1717 Lincoln Ave