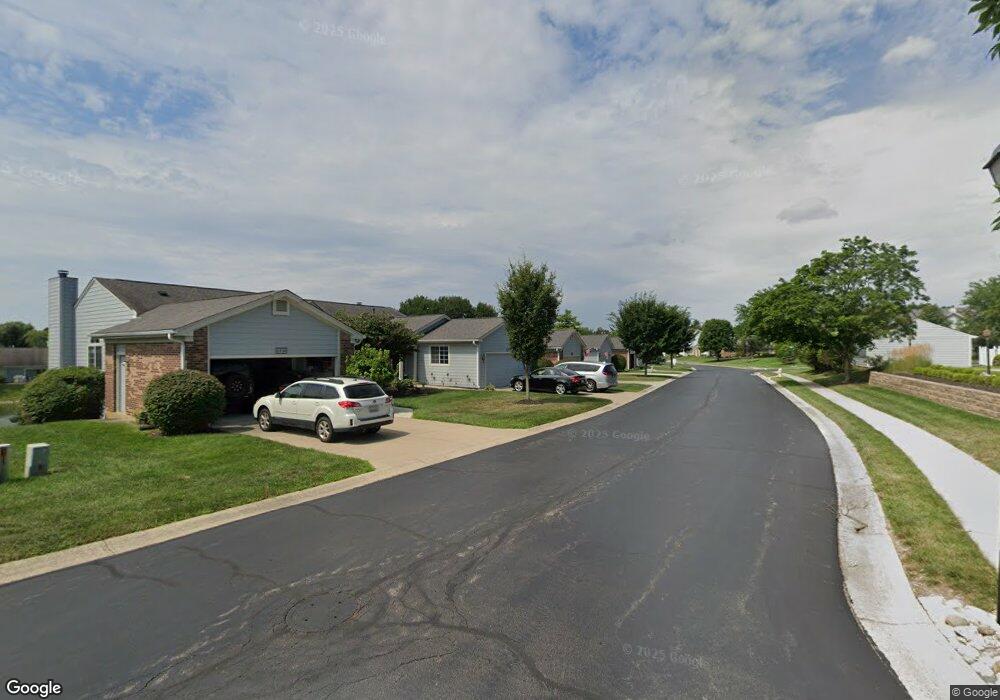
1728 Yardley Cir Unit 1728 Dayton, OH 45459
Estimated Value: $276,000 - $335,000
3
Beds
3
Baths
1,353
Sq Ft
$227/Sq Ft
Est. Value
About This Home
This home is located at 1728 Yardley Cir Unit 1728, Dayton, OH 45459 and is currently estimated at $306,882, approximately $226 per square foot. 1728 Yardley Cir Unit 1728 is a home located in Montgomery County with nearby schools including Primary Village North, Driscoll Elementary School, and Tower Heights Middle School.
Ownership History
Date
Name
Owned For
Owner Type
Purchase Details
Closed on
Sep 15, 2020
Sold by
Heddings Rebecca
Bought by
Heddings Rebbecca E and The Heddings Revocable Living
Current Estimated Value
Purchase Details
Closed on
Sep 28, 2018
Sold by
Leakas Mary R
Bought by
Heddings Rebecca
Purchase Details
Closed on
Dec 2, 2009
Sold by
Leakas Mary R and Revocable Inter Vivos Trust Of
Bought by
Leakas Mary R
Purchase Details
Closed on
Aug 7, 2009
Sold by
Jacobson James L and Leakas Mary R
Bought by
Leakas Mary R and Revocable Inter Vivos Trust Of
Purchase Details
Closed on
Dec 22, 2005
Sold by
Leakas Theodore J and Leakas Mary R
Bought by
Leakas Theodore J and Leakas Mary R
Purchase Details
Closed on
Jul 9, 1997
Sold by
Benson Nancy
Bought by
Leakas Theodore and Leakas Mary R
Purchase Details
Closed on
Aug 22, 1996
Sold by
Bauer Vincent J
Bought by
Benson Barbara Jean
Create a Home Valuation Report for This Property
The Home Valuation Report is an in-depth analysis detailing your home's value as well as a comparison with similar homes in the area
Home Values in the Area
Average Home Value in this Area
Purchase History
| Date | Buyer | Sale Price | Title Company |
|---|---|---|---|
| Heddings Rebbecca E | -- | None Available | |
| Heddings Rebecca | $200,000 | None Available | |
| Leakas Mary R | -- | Attorney | |
| Leakas Mary R | $92,500 | Attorney | |
| Leakas Theodore J | -- | None Available | |
| Leakas Theodore | $160,000 | -- | |
| Benson Barbara Jean | $157,200 | -- |
Source: Public Records
Tax History Compared to Growth
Tax History
| Year | Tax Paid | Tax Assessment Tax Assessment Total Assessment is a certain percentage of the fair market value that is determined by local assessors to be the total taxable value of land and additions on the property. | Land | Improvement |
|---|---|---|---|---|
| 2024 | $5,622 | $96,820 | $12,740 | $84,080 |
| 2023 | $5,622 | $96,820 | $12,740 | $84,080 |
| 2022 | $5,433 | $74,220 | $9,800 | $64,420 |
| 2021 | $5,448 | $74,220 | $9,800 | $64,420 |
| 2020 | $5,441 | $74,220 | $9,800 | $64,420 |
| 2019 | $6,255 | $76,200 | $9,800 | $66,400 |
| 2018 | $5,544 | $76,200 | $9,800 | $66,400 |
| 2017 | $5,479 | $76,200 | $9,800 | $66,400 |
| 2016 | $4,958 | $65,040 | $9,800 | $55,240 |
| 2015 | $4,907 | $65,040 | $9,800 | $55,240 |
| 2014 | $4,907 | $65,040 | $9,800 | $55,240 |
| 2012 | -- | $62,230 | $9,800 | $52,430 |
Source: Public Records
Map
Nearby Homes
- 6694 Wareham Ct
- 6625 Hedington Square
- 6650 Wareham Ct Unit 5
- 6611 Brigham Square Unit 2
- 1511 Lake Pointe Way Unit 6
- 6620 Green Branch Dr Unit 8
- 1953 Baldwin Dr
- 6610 Green Branch Dr
- 1973 Home Path Ct
- 1400 Lake Pointe Way Unit 4
- 6331 Adams Cir Unit 16
- 1237 Chevington Ct Unit 1515
- 6184 Quinella Way Unit 185
- 1740 Piper Ln Unit 102
- 1740 Piper Ln
- 1630 Piper Ln Unit 103
- 1630 Piper Ln
- 6161 Quinella Way Unit 208
- 1780 Piper Ln Unit 206
- 1770 Piper Ln Unit 208
- 1726 Yardley Cir Unit 1726
- 1730 Yardley Cir Unit 1730
- 1722 Yardley Cir Unit 1722
- 1734 Yardley Cir Unit 1734
- 1720 Yardley Cir Unit 1720
- 6671 Hedington Square
- 6671 Hedington Square Unit 6671
- 6675 Hedington Square Unit 6675
- 1800 Yardley Cir Unit 1800
- 6661 Hedington Square Unit 7
- 6661 Hedington Square Unit 2
- 6661 Hedington Square Unit 66617
- 6661 Hedington Square Unit 66616
- 6661 Hedington Square Unit 66615
- 6661 Hedington Square Unit 66614
- 6661 Hedington Square Unit 66613
- 6661 Hedington Square Unit 66611
- 6661 Hedington Square Unit 5
- 6661 Hedington Square
- 6661 Hedington Square Unit 1