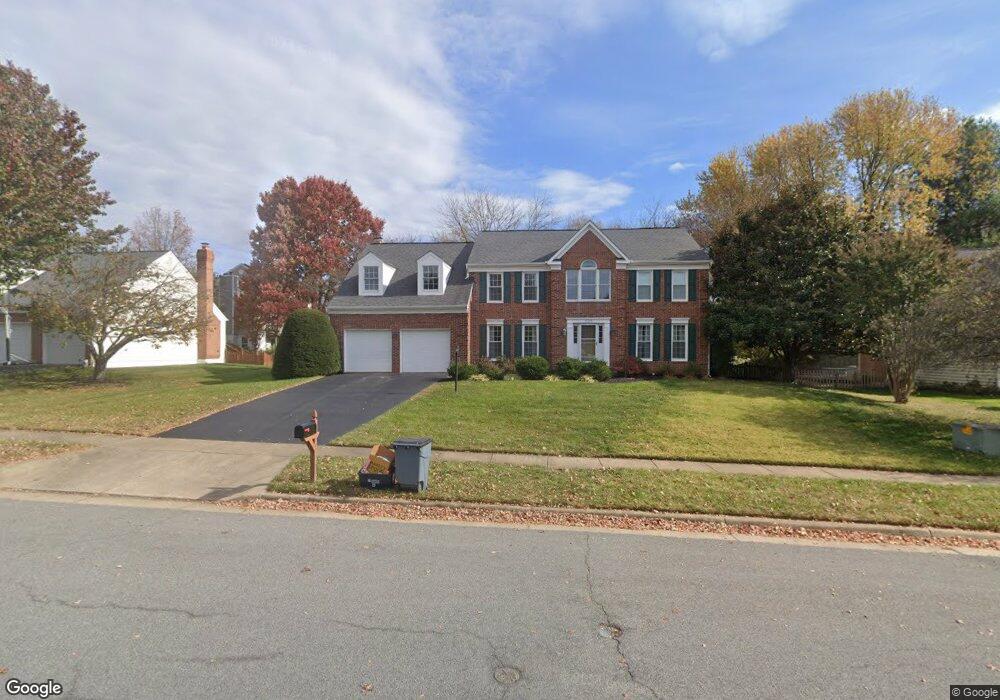
17280 Pickwick Dr Unit 28 Purcellville, VA 20132
Estimated Value: $838,000 - $892,000
5
Beds
4
Baths
4,104
Sq Ft
$209/Sq Ft
Est. Value
About This Home
This home is located at 17280 Pickwick Dr Unit 28, Purcellville, VA 20132 and is currently estimated at $856,144, approximately $208 per square foot. 17280 Pickwick Dr Unit 28 is a home located in Loudoun County with nearby schools including Kenneth W. Culbert Elementary School, Blue Ridge Middle School, and Loudoun Valley High School.
Ownership History
Date
Name
Owned For
Owner Type
Purchase Details
Closed on
Sep 30, 2010
Sold by
Larry Thomas L
Bought by
Minnick Brook W
Current Estimated Value
Home Financials for this Owner
Home Financials are based on the most recent Mortgage that was taken out on this home.
Original Mortgage
$348,000
Outstanding Balance
$230,693
Interest Rate
4.44%
Mortgage Type
New Conventional
Estimated Equity
$625,451
Purchase Details
Closed on
Mar 1, 2004
Sold by
Martin James
Bought by
Larry Thomas
Purchase Details
Closed on
Jan 6, 2004
Sold by
Combs Stephen
Bought by
Larry Thomas
Purchase Details
Closed on
Jul 1, 1998
Sold by
J B Purcellville Llc
Bought by
Richmond American Homes Va Inc
Create a Home Valuation Report for This Property
The Home Valuation Report is an in-depth analysis detailing your home's value as well as a comparison with similar homes in the area
Home Values in the Area
Average Home Value in this Area
Purchase History
| Date | Buyer | Sale Price | Title Company |
|---|---|---|---|
| Minnick Brook W | $435,000 | -- | |
| Larry Thomas | $295,000 | -- | |
| Larry Thomas | $410,000 | -- | |
| Richmond American Homes Va Inc | $309,000 | -- |
Source: Public Records
Mortgage History
| Date | Status | Borrower | Loan Amount |
|---|---|---|---|
| Open | Minnick Brook W | $348,000 |
Source: Public Records
Tax History Compared to Growth
Tax History
| Year | Tax Paid | Tax Assessment Tax Assessment Total Assessment is a certain percentage of the fair market value that is determined by local assessors to be the total taxable value of land and additions on the property. | Land | Improvement |
|---|---|---|---|---|
| 2025 | $6,764 | $810,050 | $212,300 | $597,750 |
| 2024 | $6,732 | $752,200 | $212,300 | $539,900 |
| 2023 | $6,058 | $692,390 | $212,300 | $480,090 |
| 2022 | $5,715 | $642,150 | $184,900 | $457,250 |
| 2021 | $5,657 | $577,270 | $144,900 | $432,370 |
| 2020 | $5,258 | $508,030 | $144,900 | $363,130 |
| 2019 | $5,330 | $510,040 | $124,900 | $385,140 |
| 2018 | $5,273 | $486,010 | $124,900 | $361,110 |
| 2017 | $5,317 | $472,580 | $124,900 | $347,680 |
| 2016 | $5,336 | $466,000 | $0 | $0 |
| 2015 | $5,231 | $335,950 | $0 | $335,950 |
| 2014 | $5,207 | $325,880 | $0 | $325,880 |
Source: Public Records
Map
Nearby Homes
- 17431 Aldershot Place
- 17443 Aldershot Place
- 113 Frazer Dr
- 115 Frazer Dr
- 14649 Fordson Ct
- 14691 Fordson Ct
- 14629 Fordson Ct
- 221 S Maple Ave
- 485 Wordsworth Cir
- 401 E Loudoun Valley Dr
- 609 S Maple Ave
- 116 Desales Dr
- 109 Amalfi Ct
- 648 Elliot Dr
- Hillsboro Plan at Woodside Acres
- Robey Plan at Woodside Acres
- Chapman Plan at Woodside Acres
- Aquinnah Plan at Woodside Acres
- Millwright II Plan at Woodside Acres
- 230 N Brewster Ln
- 17280 Pickwick Dr
- 37820 Perkins Ct
- 17284 Pickwick Dr Unit 27
- 17284 Pickwick Dr
- 17276 Pickwick Dr
- 37775 Eastgate Dr
- 37821 Perkins Ct
- 37821 Perkins Ct Unit 51
- 37824 Perkins Ct
- 17273 Pickwick Dr
- 17281 Pickwick Dr
- 37779 Eastgate Dr
- 17288 Pickwick Dr
- 17269 Pickwick Dr
- 17285 Pickwick Dr
- 17285 Pickwick Dr Unit 12
- 37825 Perkins Ct
- 37825 Perkins Ct Unit 50
- 37828 Perkins Ct
- 37828 Perkins Ct Unit 54