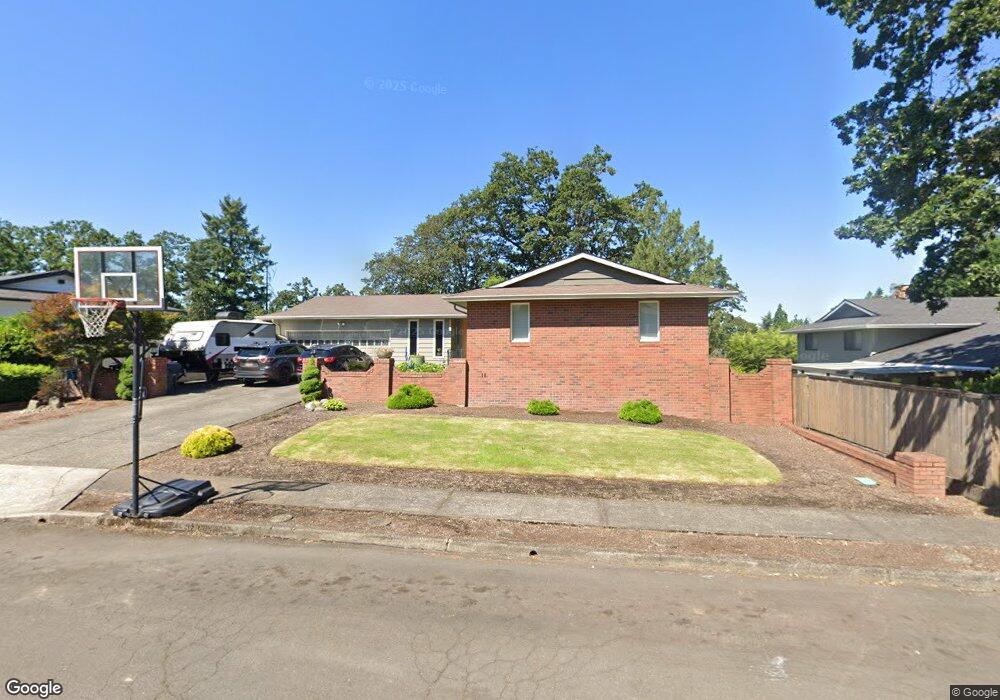
17285 Lundgren Way Gladstone, OR 97027
Estimated Value: $617,000 - $693,000
4
Beds
3
Baths
3,120
Sq Ft
$210/Sq Ft
Est. Value
About This Home
This home is located at 17285 Lundgren Way, Gladstone, OR 97027 and is currently estimated at $653,843, approximately $209 per square foot. 17285 Lundgren Way is a home located in Clackamas County with nearby schools including John Wetten Elementary School, Walter L Kraxberger Middle School, and Gladstone High School.
Ownership History
Date
Name
Owned For
Owner Type
Purchase Details
Closed on
Feb 5, 2009
Sold by
Zirkle Gabriel
Bought by
Jobe John O and Jobe Elena A
Current Estimated Value
Home Financials for this Owner
Home Financials are based on the most recent Mortgage that was taken out on this home.
Original Mortgage
$362,000
Outstanding Balance
$226,100
Interest Rate
5.04%
Mortgage Type
VA
Estimated Equity
$427,743
Purchase Details
Closed on
Jun 1, 2007
Sold by
Patenburg Dorothy M
Bought by
Zirkle Gabriel
Home Financials for this Owner
Home Financials are based on the most recent Mortgage that was taken out on this home.
Original Mortgage
$276,750
Interest Rate
6.12%
Mortgage Type
Purchase Money Mortgage
Purchase Details
Closed on
Mar 17, 2005
Sold by
Cox Rene Lynn
Bought by
Pantenburg Dorothy Mae and Thomas Davis C
Purchase Details
Closed on
Mar 15, 2003
Sold by
Pantenburg Dorothy Mae and Thomas Davis C
Bought by
Davis C Thomas and Pantenburg Dorothy Mae
Create a Home Valuation Report for This Property
The Home Valuation Report is an in-depth analysis detailing your home's value as well as a comparison with similar homes in the area
Home Values in the Area
Average Home Value in this Area
Purchase History
| Date | Buyer | Sale Price | Title Company |
|---|---|---|---|
| Jobe John O | $362,000 | Ticor Title | |
| Zirkle Gabriel | $307,500 | Ticor Title Insurance Compan | |
| Pantenburg Dorothy Mae | -- | -- | |
| Davis C Thomas | -- | -- |
Source: Public Records
Mortgage History
| Date | Status | Borrower | Loan Amount |
|---|---|---|---|
| Open | Jobe John O | $362,000 | |
| Previous Owner | Zirkle Gabriel | $276,750 |
Source: Public Records
Tax History
| Year | Tax Paid | Tax Assessment Tax Assessment Total Assessment is a certain percentage of the fair market value that is determined by local assessors to be the total taxable value of land and additions on the property. | Land | Improvement |
|---|---|---|---|---|
| 2025 | $7,159 | $355,293 | -- | -- |
| 2024 | $6,960 | $344,945 | -- | -- |
| 2023 | $6,960 | $334,899 | $0 | $0 |
| 2022 | $6,473 | $325,145 | $0 | $0 |
| 2021 | $6,235 | $315,675 | $0 | $0 |
| 2020 | $6,086 | $306,481 | $0 | $0 |
| 2019 | $6,016 | $297,555 | $0 | $0 |
| 2018 | $5,797 | $288,888 | $0 | $0 |
| 2017 | $5,624 | $280,474 | $0 | $0 |
| 2016 | $5,438 | $272,305 | $0 | $0 |
Source: Public Records
Map
Nearby Homes
- 8117 Cox Ln
- 17788 Webster Rd
- 7655 Ridgewood Dr
- 7175 Ridgegate Dr
- 17928 Webster Rd
- 17900 Monticello Dr
- 16921 SE 80th Place
- 17915 Monticello Dr
- 16981 SE 80th Place
- 16421 SE Webster Rd
- 16510 SE 81st Ave
- 8370 SE Poppy St
- 16232 SE Lillian Ct
- 16261 SE 79th Ave
- 16260 SE 80th Ave
- 17520 SE 82nd Dr
- 16383 SE Merganser Ct
- 16615 Churchill Dr
- 6830 Glen Echo Ave
- 7808 SE Roots Rd
- 17295 Lundgren Way
- 17280 Charolais Way
- 17280 Re Listed Home
- 7530 Cason Ln
- 17290 Charolais Way
- 17280 SE Lundgren Way
- 17280 Lundgren Way
- 17270 Lundgren Way
- 17290 Lundgren Way
- 17305 Lundgren Way
- 17300 Charolais Way
- 17300 Lundgren Way
- 7545 Cason Ln
- 7535 Cason Ln
- 7555 Cason Ln
- 7515 Charolais Dr
- 17285 Charolais Way
- 17285 Craig Ct
- 17295 Craig Ct
- 7525 Cason Ln
Your Personal Tour Guide
Ask me questions while you tour the home.