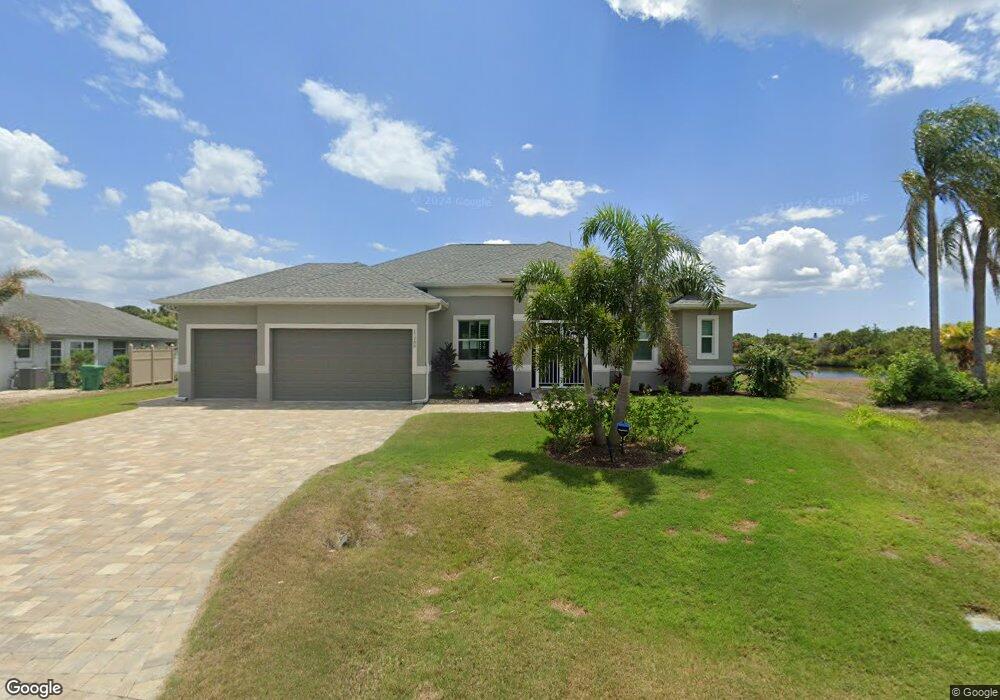
17288 Pheasant Cir Port Charlotte, FL 33948
Estimated Value: $537,000 - $849,491
--
Bed
3
Baths
2,548
Sq Ft
$280/Sq Ft
Est. Value
About This Home
This home is located at 17288 Pheasant Cir, Port Charlotte, FL 33948 and is currently estimated at $712,873, approximately $279 per square foot. 17288 Pheasant Cir is a home located in Charlotte County with nearby schools including Meadow Park Elementary School, Murdock Middle School, and Port Charlotte High School.
Ownership History
Date
Name
Owned For
Owner Type
Purchase Details
Closed on
Sep 19, 2016
Sold by
Pickel Jseph
Bought by
Stromback Dale T and Stromback Heidi J
Current Estimated Value
Purchase Details
Closed on
Oct 28, 2014
Sold by
Rozsypalek Lukas
Bought by
Pickel Joseph
Purchase Details
Closed on
May 14, 2012
Sold by
Popa Dennis T
Bought by
Rozsypalek Lukas
Purchase Details
Closed on
Jun 30, 2005
Sold by
Meyer Steven L and Meyer Jane C
Bought by
Popa Dennis T
Home Financials for this Owner
Home Financials are based on the most recent Mortgage that was taken out on this home.
Original Mortgage
$285,000
Interest Rate
6.12%
Mortgage Type
Purchase Money Mortgage
Purchase Details
Closed on
Jan 2, 2004
Sold by
Pozzoli Alfred P and Pozzoli Esther J
Bought by
Meyer Steven L and Meyer Jane C
Purchase Details
Closed on
Apr 26, 1995
Sold by
Pozzoli Alfred P and Pozzoli Esther J
Bought by
Pozzoli Alfred P
Create a Home Valuation Report for This Property
The Home Valuation Report is an in-depth analysis detailing your home's value as well as a comparison with similar homes in the area
Home Values in the Area
Average Home Value in this Area
Purchase History
| Date | Buyer | Sale Price | Title Company |
|---|---|---|---|
| Stromback Dale T | $57,000 | Msc Title Inc | |
| Pickel Joseph | $59,900 | Florida Abstract & Security | |
| Rozsypalek Lukas | $33,400 | None Available | |
| Popa Dennis T | $300,000 | Csb Title Services | |
| Meyer Steven L | $125,000 | -- | |
| Pozzoli Alfred P | -- | -- |
Source: Public Records
Mortgage History
| Date | Status | Borrower | Loan Amount |
|---|---|---|---|
| Previous Owner | Popa Dennis T | $285,000 |
Source: Public Records
Tax History Compared to Growth
Tax History
| Year | Tax Paid | Tax Assessment Tax Assessment Total Assessment is a certain percentage of the fair market value that is determined by local assessors to be the total taxable value of land and additions on the property. | Land | Improvement |
|---|---|---|---|---|
| 2023 | $7,145 | $438,486 | $0 | $0 |
| 2022 | $6,892 | $425,715 | $0 | $0 |
| 2021 | $6,928 | $413,316 | $53,843 | $359,473 |
| 2020 | $7,021 | $418,125 | $53,843 | $364,282 |
| 2019 | $1,168 | $48,997 | $48,997 | $0 |
| 2018 | $1,118 | $48,459 | $48,459 | $0 |
| 2017 | $1,084 | $45,767 | $45,767 | $0 |
| 2016 | $1,121 | $44,152 | $0 | $0 |
| 2015 | $1,134 | $44,152 | $0 | $0 |
| 2014 | $980 | $29,640 | $0 | $0 |
Source: Public Records
Map
Nearby Homes
- 17349 Pheasant Cir
- 17200 Sabrina Cir
- 4234 Library St
- 17404 Pheasant Cir
- 17209 Sabrina Cir
- 17413 Pheasant Cir
- 17412 Pheasant Cir
- 17324 Gulfspray Cir
- 17324, 17332, 17340 Gulfspray Cir
- 17306 Gulfspray Cir
- 17200 Gulfspray Cir
- 4169 Joseph St
- 4202 Perch Cir
- 17340 Gulfspray Cir
- 4133 Joseph St
- 17356 Gulfspray Cir
- 4187 Perch Cir
- 4172 Joseph St
- 17220 Horizon Ln
- 4212 Joseph St
- 17280 Pheasant Cir
- 17294 Pheasant Cir
- 17272 Pheasant Cir
- 17300 Pheasant Cir
- 17318 Sabrina Cir
- 17264 Pheasant Cir
- 17340 Sabrina Cir
- 17312 Sabrina Cir
- 17333 Pheasant Cir
- 17256 Pheasant Cir
- 4202 Library St
- 17265 Pheasant Cir
- 17348 Sabrina Cir
- 4210 Library St
- 4194 Library St
- 17315 Sabrina Cir
- 17341 Pheasant Cir
- 4218 Library St
- 4186 Library St
- 17333 Sabrina Cir