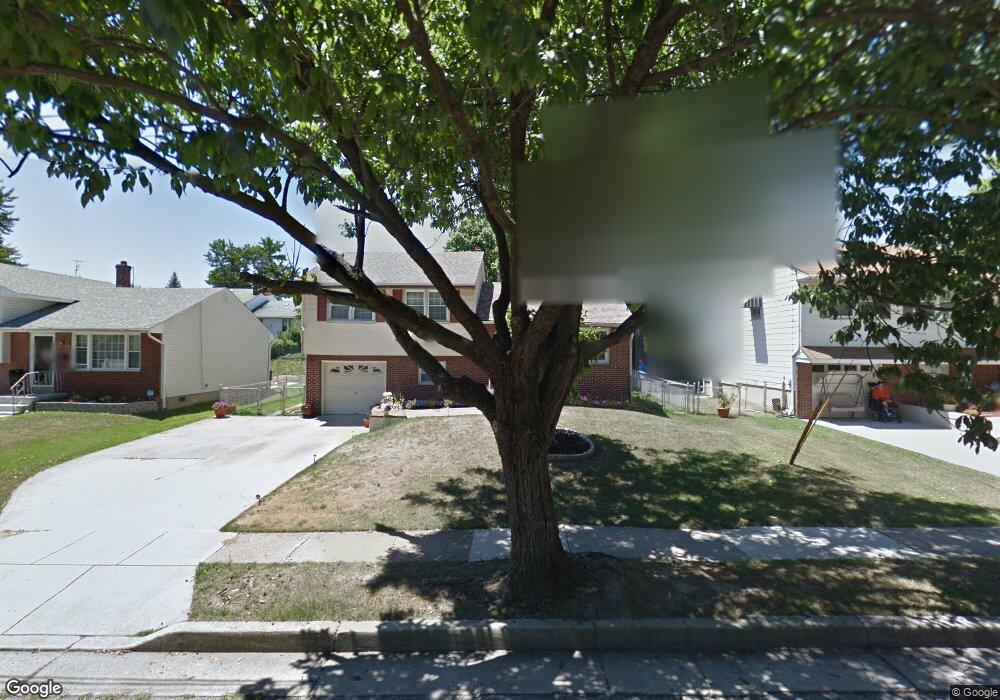
1729 37th St Pennsauken, NJ 08110
Estimated Value: $219,279 - $333,000
--
Bed
--
Bath
1,498
Sq Ft
$196/Sq Ft
Est. Value
About This Home
This home is located at 1729 37th St, Pennsauken, NJ 08110 and is currently estimated at $294,320, approximately $196 per square foot. 1729 37th St is a home located in Camden County with nearby schools including Pennsauken High School, Camden Forward School, and St. Cecilia School.
Ownership History
Date
Name
Owned For
Owner Type
Purchase Details
Closed on
Jan 19, 2018
Sold by
Morton David A and Morton Jacqueline W
Bought by
Morton David A and Morton Jacqueline W
Current Estimated Value
Home Financials for this Owner
Home Financials are based on the most recent Mortgage that was taken out on this home.
Original Mortgage
$119,000
Outstanding Balance
$32,519
Interest Rate
4.32%
Mortgage Type
New Conventional
Estimated Equity
$261,801
Purchase Details
Closed on
Jan 16, 1998
Sold by
Aguilar Edita C
Bought by
Morton David A
Home Financials for this Owner
Home Financials are based on the most recent Mortgage that was taken out on this home.
Original Mortgage
$81,000
Interest Rate
7.11%
Mortgage Type
FHA
Create a Home Valuation Report for This Property
The Home Valuation Report is an in-depth analysis detailing your home's value as well as a comparison with similar homes in the area
Home Values in the Area
Average Home Value in this Area
Purchase History
| Date | Buyer | Sale Price | Title Company |
|---|---|---|---|
| Morton David A | -- | None Available | |
| Morton David A | $81,000 | -- |
Source: Public Records
Mortgage History
| Date | Status | Borrower | Loan Amount |
|---|---|---|---|
| Open | Morton David A | $119,000 | |
| Closed | Morton David A | $81,000 |
Source: Public Records
Tax History Compared to Growth
Tax History
| Year | Tax Paid | Tax Assessment Tax Assessment Total Assessment is a certain percentage of the fair market value that is determined by local assessors to be the total taxable value of land and additions on the property. | Land | Improvement |
|---|---|---|---|---|
| 2025 | $5,240 | $255,500 | $52,000 | $203,500 |
| 2024 | $5,139 | $120,400 | $36,500 | $83,900 |
| 2023 | $5,139 | $120,400 | $36,500 | $83,900 |
| 2022 | $4,646 | $120,400 | $36,500 | $83,900 |
| 2021 | $4,771 | $120,400 | $36,500 | $83,900 |
| 2020 | $4,274 | $120,400 | $36,500 | $83,900 |
| 2019 | $4,324 | $120,400 | $36,500 | $83,900 |
| 2018 | $4,346 | $120,400 | $36,500 | $83,900 |
| 2017 | $4,355 | $120,400 | $36,500 | $83,900 |
| 2016 | $4,277 | $120,400 | $36,500 | $83,900 |
| 2015 | $4,404 | $120,400 | $36,500 | $83,900 |
| 2014 | $4,194 | $75,400 | $19,000 | $56,400 |
Source: Public Records
Map
Nearby Homes