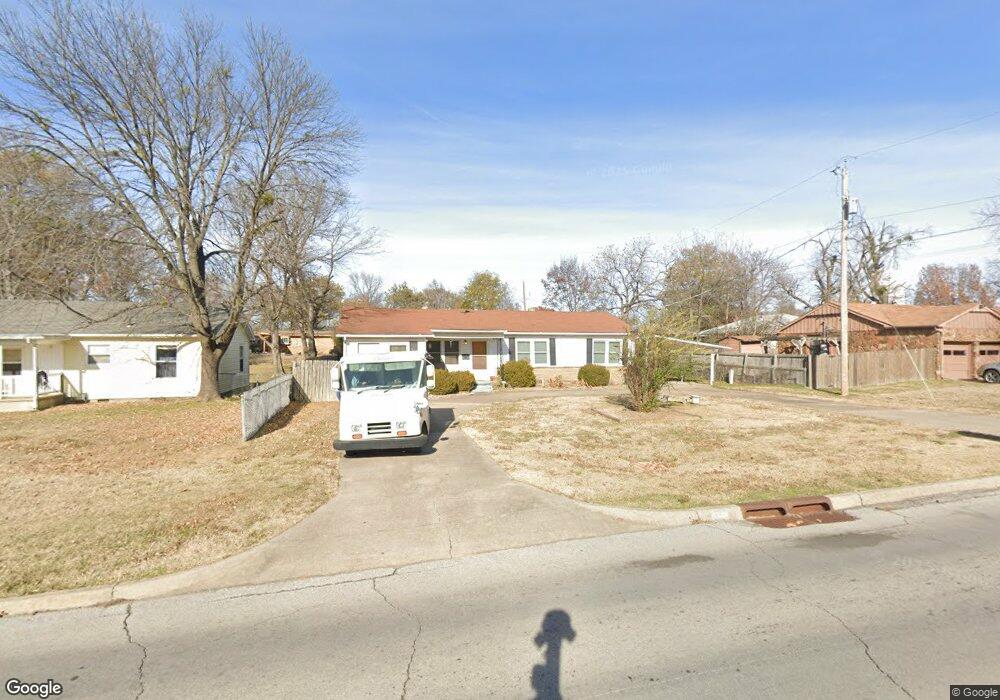
1729 E 13th St Okmulgee, OK 74447
Estimated Value: $116,433 - $147,000
3
Beds
2
Baths
1,472
Sq Ft
$89/Sq Ft
Est. Value
About This Home
This home is located at 1729 E 13th St, Okmulgee, OK 74447 and is currently estimated at $130,858, approximately $88 per square foot. 1729 E 13th St is a home located in Okmulgee County with nearby schools including Okmulgee Primary School, Dunbar Elementary School, and Okmulgee Middle School.
Ownership History
Date
Name
Owned For
Owner Type
Purchase Details
Closed on
Dec 15, 2021
Sold by
Lynn Diana
Bought by
Lynn Diana and Diana Lynn Family Trust
Current Estimated Value
Purchase Details
Closed on
Oct 7, 2008
Sold by
Burkitt Jerry and Burkitt Ladonna
Bought by
Lynn Diana
Home Financials for this Owner
Home Financials are based on the most recent Mortgage that was taken out on this home.
Original Mortgage
$67,467
Outstanding Balance
$43,743
Interest Rate
6%
Mortgage Type
FHA
Estimated Equity
$87,115
Purchase Details
Closed on
Nov 17, 2006
Sold by
Campbell William and Campbell Ul
Bought by
Burkitt Jerry B and Burkitt Ladonna
Home Financials for this Owner
Home Financials are based on the most recent Mortgage that was taken out on this home.
Original Mortgage
$55,250
Interest Rate
6.37%
Mortgage Type
Future Advance Clause Open End Mortgage
Purchase Details
Closed on
Aug 5, 1999
Sold by
Milligan Dustin
Bought by
Mcconnell Roy
Purchase Details
Closed on
Nov 12, 1998
Sold by
Henson Donald Trustee
Bought by
Milligan Dustin Earl
Create a Home Valuation Report for This Property
The Home Valuation Report is an in-depth analysis detailing your home's value as well as a comparison with similar homes in the area
Home Values in the Area
Average Home Value in this Area
Purchase History
| Date | Buyer | Sale Price | Title Company |
|---|---|---|---|
| Lynn Diana | -- | None Available | |
| Lynn Diana | $68,000 | None Available | |
| Burkitt Jerry B | $65,000 | None Available | |
| Mcconnell Roy | $50,000 | -- | |
| Milligan Dustin Earl | $35,000 | -- |
Source: Public Records
Mortgage History
| Date | Status | Borrower | Loan Amount |
|---|---|---|---|
| Open | Lynn Diana | $67,467 | |
| Previous Owner | Burkitt Jerry B | $55,250 |
Source: Public Records
Tax History
| Year | Tax Paid | Tax Assessment Tax Assessment Total Assessment is a certain percentage of the fair market value that is determined by local assessors to be the total taxable value of land and additions on the property. | Land | Improvement |
|---|---|---|---|---|
| 2025 | $787 | $8,594 | $583 | $8,011 |
| 2024 | $747 | $8,247 | $583 | $7,664 |
| 2023 | $717 | $8,421 | $583 | $7,838 |
| 2022 | $678 | $8,020 | $583 | $7,437 |
| 2021 | $675 | $8,020 | $583 | $7,437 |
| 2020 | $643 | $7,274 | $583 | $6,691 |
| 2019 | $612 | $6,928 | $583 | $6,345 |
| 2018 | $590 | $6,598 | $583 | $6,015 |
| 2017 | $556 | $6,284 | $583 | $5,701 |
| 2016 | $531 | $5,985 | $583 | $5,402 |
| 2015 | $535 | $6,213 | $583 | $5,630 |
| 2014 | $707 | $8,160 | $583 | $7,577 |
Source: Public Records
Map
Nearby Homes
- 1725 E Elm Ln
- 1730 E 11th St
- 1918 Crestview Dr
- 720 S Liberty Ave
- 714 Cedar Ln
- 1724 E 8th St
- 2 S Mission Ave
- 1414 E 8th St
- 1636 E 4th St
- 888 Timbercrest Ave
- 5 Timbercrest Ave
- 125 E Southbrook Ave
- 1408 E 6th St
- 2200 Southbrook Ave
- 125 Southbrook Ave
- 1928 E 9th
- 35 E 9th
- 724 S Lake Ave
- 1500 E 3rd St
- 1300 E 7th St
- 1725 E 13th St
- 1733 E 13th St
- 816 S Mission Ln
- 1730 E Elm Ln
- 812 S Mission Ln
- 1721 E 13th St
- 1726 E Elm Ln
- 1730 E 13th St
- 1734 E Elm Ln
- 1722 E Elm Ln
- 1700 E 13th St
- 1801 Crestview Dr
- 1732 E 13th St
- 1802 E Elm Ln
- 1663 E 13th St
- 1733 E Elm Ln
- 806 S Prairie Ave
- 1664 E 13th St
- 1803 Crestview Dr
- 914 S Mission Ln
Your Personal Tour Guide
Ask me questions while you tour the home.