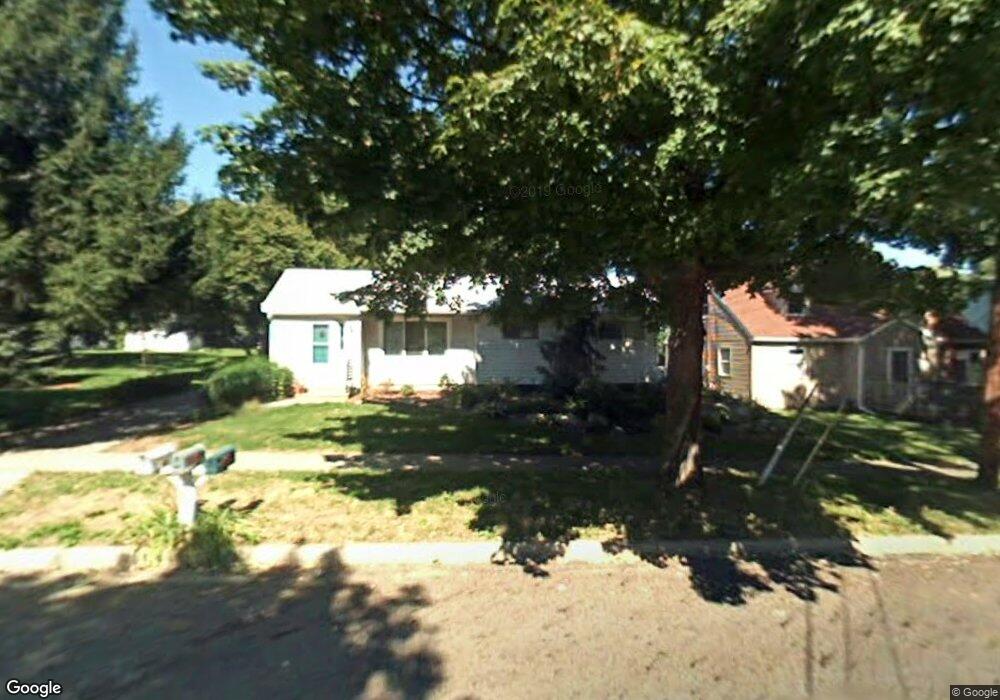
1729 Melrose Ave East Lansing, MI 48823
Estimated Value: $282,000 - $302,519
4
Beds
4
Baths
1,514
Sq Ft
$193/Sq Ft
Est. Value
About This Home
This home is located at 1729 Melrose Ave, East Lansing, MI 48823 and is currently estimated at $292,880, approximately $193 per square foot. 1729 Melrose Ave is a home located in Ingham County with nearby schools including Marble Elementary School, MacDonald Middle School, and East Lansing High School.
Ownership History
Date
Name
Owned For
Owner Type
Purchase Details
Closed on
May 12, 2016
Sold by
Amundsen Sandra A and Amundsen Robert L
Bought by
Amundsen Sandra A and Sandra A Amundsen Declaration Of Trust
Current Estimated Value
Purchase Details
Closed on
Sep 1, 1999
Sold by
Amundsen Robert L
Bought by
Amundsen Robert L and Amundsen Sandra
Create a Home Valuation Report for This Property
The Home Valuation Report is an in-depth analysis detailing your home's value as well as a comparison with similar homes in the area
Home Values in the Area
Average Home Value in this Area
Purchase History
| Date | Buyer | Sale Price | Title Company |
|---|---|---|---|
| Amundsen Sandra A | -- | None Available | |
| Amundsen Robert L | -- | First American Title Ins Co |
Source: Public Records
Tax History Compared to Growth
Tax History
| Year | Tax Paid | Tax Assessment Tax Assessment Total Assessment is a certain percentage of the fair market value that is determined by local assessors to be the total taxable value of land and additions on the property. | Land | Improvement |
|---|---|---|---|---|
| 2025 | $4,912 | $153,100 | $27,700 | $125,400 |
| 2024 | -- | $139,000 | $27,700 | $111,300 |
| 2023 | $4,587 | $120,800 | $23,700 | $97,100 |
| 2022 | $4,395 | $107,100 | $20,500 | $86,600 |
| 2021 | $4,320 | $100,500 | $19,500 | $81,000 |
| 2020 | $4,272 | $94,700 | $19,500 | $75,200 |
| 2019 | $4,098 | $86,600 | $21,100 | $65,500 |
| 2018 | $4,481 | $87,700 | $15,300 | $72,400 |
| 2017 | $4,212 | $86,100 | $15,500 | $70,600 |
| 2016 | -- | $77,400 | $14,900 | $62,500 |
| 2015 | -- | $72,200 | $27,473 | $44,727 |
| 2014 | -- | $68,300 | $27,473 | $40,827 |
Source: Public Records
Map
Nearby Homes
- 688 Moorland Dr Unit 9
- 5435 Blue Haven Dr
- 586 Lexington Ave
- 831 Lenna Keith Cir Unit 22
- 1719 Woodside Dr
- 235 Maplewood Dr
- 933 Bedford Rd
- 5190 Park Lake Rd
- 1544 Haslett Rd
- 5604 Deville Ct
- 1124 Burcham Dr
- 5680 Deville Ct Unit 61
- 2617 Greencliff Dr
- 15403 Short St
- 5359 Wild Oak Dr Unit 54
- 2446 S Wild Blossom Ct
- 696 Beech St
- 1539 N Hagadorn Rd Unit 1A
- 1531 Winchell Ct
- 0 Hagadorn Lot D Rd
- 1741 Melrose Ave
- 525 Moorland Dr
- 508 Wayland Ave
- 516 Wayland Ave
- 516 E Wayland 524
- 1747 Melrose Ave
- 529 Moorland Dr
- 532 Wayland Ave
- 1724 Snyder Rd
- 1718 Melrose Ave
- 466 Wayland Ave
- 0 Wayland Ave
- 1736 Snyder Rd
- 1730 Melrose Ave
- 1805 Melrose Ave
- 1805 E Melrose A Ve
- 542 Wayland Ave
- 467 Moorland Dr
- 1677 Melrose Ave
- 464 Wayland Ave