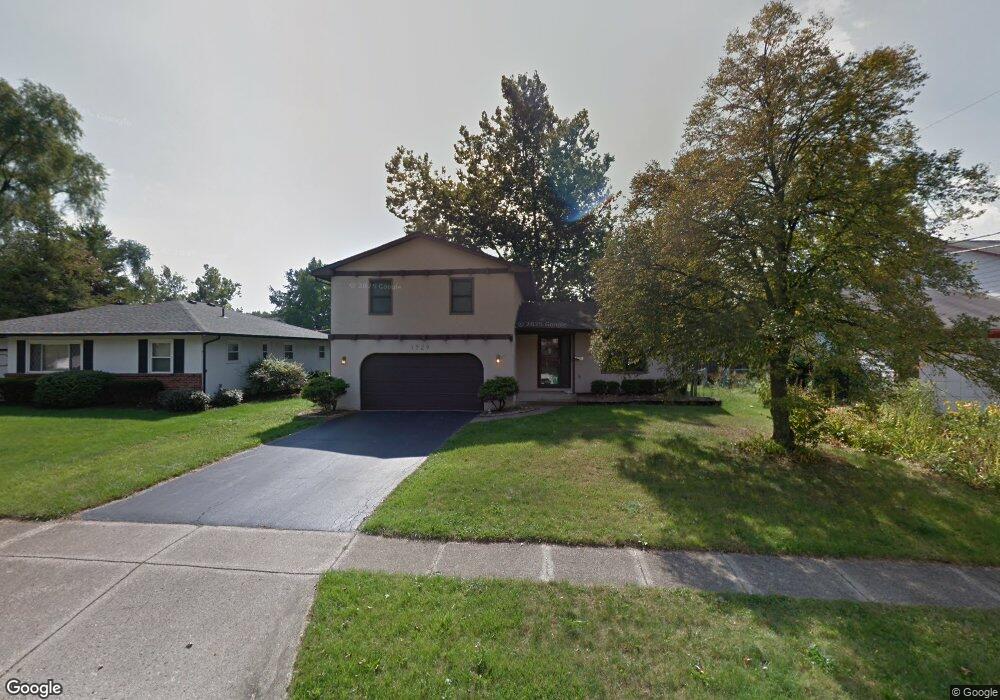
1729 Rocky Pine Loop S Columbus, OH 43229
Forest Park East NeighborhoodEstimated Value: $258,000 - $328,000
3
Beds
3
Baths
2,000
Sq Ft
$144/Sq Ft
Est. Value
About This Home
This home is located at 1729 Rocky Pine Loop S, Columbus, OH 43229 and is currently estimated at $288,217, approximately $144 per square foot. 1729 Rocky Pine Loop S is a home located in Franklin County with nearby schools including Forest Park Elementary School, Woodward Park Middle School, and Northland High School.
Ownership History
Date
Name
Owned For
Owner Type
Purchase Details
Closed on
May 30, 2008
Sold by
Davis David K and Davis Kimberly Lutz
Bought by
Gaynor Shannon F
Current Estimated Value
Home Financials for this Owner
Home Financials are based on the most recent Mortgage that was taken out on this home.
Original Mortgage
$123,000
Outstanding Balance
$77,382
Interest Rate
6.01%
Mortgage Type
Purchase Money Mortgage
Estimated Equity
$210,835
Purchase Details
Closed on
Jan 24, 2002
Sold by
Giffen Robert E and Giffen Dianna M
Bought by
Davis David K and Davis Kimberly Lutz
Purchase Details
Closed on
Jun 12, 1972
Bought by
Giffen Robert E
Create a Home Valuation Report for This Property
The Home Valuation Report is an in-depth analysis detailing your home's value as well as a comparison with similar homes in the area
Home Values in the Area
Average Home Value in this Area
Purchase History
| Date | Buyer | Sale Price | Title Company |
|---|---|---|---|
| Gaynor Shannon F | $130,000 | Talon Group | |
| Davis David K | $126,500 | Chicago Title West | |
| Giffen Robert E | -- | -- |
Source: Public Records
Mortgage History
| Date | Status | Borrower | Loan Amount |
|---|---|---|---|
| Open | Gaynor Shannon F | $123,000 |
Source: Public Records
Tax History
| Year | Tax Paid | Tax Assessment Tax Assessment Total Assessment is a certain percentage of the fair market value that is determined by local assessors to be the total taxable value of land and additions on the property. | Land | Improvement |
|---|---|---|---|---|
| 2025 | $3,356 | $74,770 | $19,640 | $55,130 |
| 2024 | $3,356 | $74,770 | $19,640 | $55,130 |
| 2023 | $3,313 | $74,770 | $19,640 | $55,130 |
| 2022 | $2,745 | $52,920 | $12,530 | $40,390 |
| 2021 | $2,832 | $52,920 | $12,530 | $40,390 |
| 2020 | $2,753 | $52,920 | $12,530 | $40,390 |
| 2019 | $2,363 | $38,960 | $9,280 | $29,680 |
| 2018 | $2,237 | $38,960 | $9,280 | $29,680 |
| 2017 | $2,362 | $38,960 | $9,280 | $29,680 |
| 2016 | $2,330 | $35,180 | $8,720 | $26,460 |
| 2015 | $2,116 | $35,180 | $8,720 | $26,460 |
| 2014 | $2,121 | $35,180 | $8,720 | $26,460 |
| 2013 | $1,101 | $37,030 | $9,170 | $27,860 |
Source: Public Records
Map
Nearby Homes
- 5486 Pine Bluff Rd
- 1687 Brookfield Square S
- 5485 Tamarack Blvd
- 5762 Pine Tree St W Unit D
- 1638 Arrowood Loop N
- 1469 Sandalwood Place
- 5726 Beechcroft Rd Unit J
- 5732 Beechcroft Rd Unit B
- 5231 Arrowood Ct
- 5844 Thada Ln Unit 5844
- 5399 Teakwood Ct
- 5458 Sumac Loop S
- 5396 Teakwood Ct
- 1390 E Dublin Granville Rd
- 5885 Beechcroft Rd Unit 116
- 5885 Beechcroft Rd Unit 313
- 6035 Karl Rd
- 5990 Ambleside Dr
- 5733 Satinwood Dr
- 5690 Ironwood Ct
- 1737 Rocky Pine Loop S
- 1721 Rocky Pine Loop S
- 1728 Blue Ash Place
- 1709 Rocky Pine Loop S
- 1745 Rocky Pine Loop S
- 1738 Blue Ash Place
- 1712 Blue Ash Place
- 1728 Rocky Pine Loop S
- 1746 Blue Ash Place
- 1734 Rocky Pine Loop S
- 1720 Rocky Pine Loop S
- 1701 Rocky Pine Loop S
- 1742 Rocky Pine Loop S
- 1704 Blue Ash Place
- 1712 Rocky Pine Loop S
- 5531 Larkwood Rd
- 1752 Rocky Pine Loop S
- 1708 Rocky Pine Loop S
- 1696 Blue Ash Place
- 1693 Rocky Pine Loop S
Your Personal Tour Guide
Ask me questions while you tour the home.