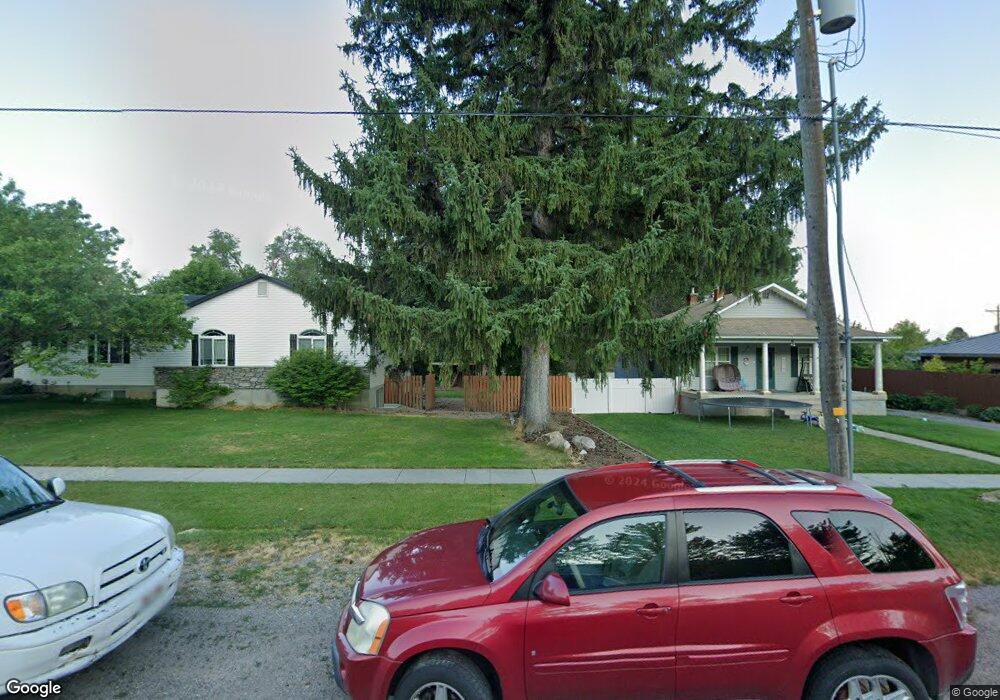
173 1/2 N Main St Providence, UT 84332
Estimated Value: $484,000 - $576,000
--
Bed
--
Bath
1,835
Sq Ft
$291/Sq Ft
Est. Value
About This Home
This home is located at 173 1/2 N Main St, Providence, UT 84332 and is currently estimated at $533,793, approximately $290 per square foot. 173 1/2 N Main St is a home with nearby schools including Providence School, Spring Creek Middle School, and South Cache Middle School.
Ownership History
Date
Name
Owned For
Owner Type
Purchase Details
Closed on
Aug 2, 2023
Sold by
Stanko Brian L
Bought by
Stanko Brian L and Stanko Sheri Lea
Current Estimated Value
Home Financials for this Owner
Home Financials are based on the most recent Mortgage that was taken out on this home.
Original Mortgage
$247,500
Outstanding Balance
$241,213
Interest Rate
6.67%
Mortgage Type
New Conventional
Estimated Equity
$292,580
Purchase Details
Closed on
Apr 13, 2021
Sold by
Kropf Freda Earline Floyd
Bought by
Kropf Ward Sheri Lea
Create a Home Valuation Report for This Property
The Home Valuation Report is an in-depth analysis detailing your home's value as well as a comparison with similar homes in the area
Home Values in the Area
Average Home Value in this Area
Purchase History
| Date | Buyer | Sale Price | Title Company |
|---|---|---|---|
| Stanko Brian L | -- | None Listed On Document | |
| Stanko Brian L | -- | None Listed On Document | |
| Kropf Ward Sheri Lea | -- | -- |
Source: Public Records
Mortgage History
| Date | Status | Borrower | Loan Amount |
|---|---|---|---|
| Open | Stanko Brian L | $247,500 |
Source: Public Records
Tax History Compared to Growth
Tax History
| Year | Tax Paid | Tax Assessment Tax Assessment Total Assessment is a certain percentage of the fair market value that is determined by local assessors to be the total taxable value of land and additions on the property. | Land | Improvement |
|---|---|---|---|---|
| 2025 | $2,096 | $293,870 | $0 | $0 |
| 2024 | $2,242 | $292,420 | $0 | $0 |
| 2023 | $2,788 | $297,000 | $0 | $0 |
| 2022 | $2,454 | $284,810 | $0 | $0 |
| 2021 | $2,337 | $415,600 | $74,800 | $340,800 |
| 2020 | $2,175 | $358,800 | $74,800 | $284,000 |
| 2019 | $1,851 | $289,031 | $74,800 | $214,231 |
| 2018 | $1,608 | $256,352 | $74,800 | $181,552 |
| 2017 | $1,467 | $123,805 | $0 | $0 |
| 2016 | $1,483 | $123,805 | $0 | $0 |
| 2015 | $1,487 | $123,805 | $0 | $0 |
| 2014 | $1,292 | $110,290 | $0 | $0 |
| 2013 | -- | $110,290 | $0 | $0 |
Source: Public Records
Map
Nearby Homes